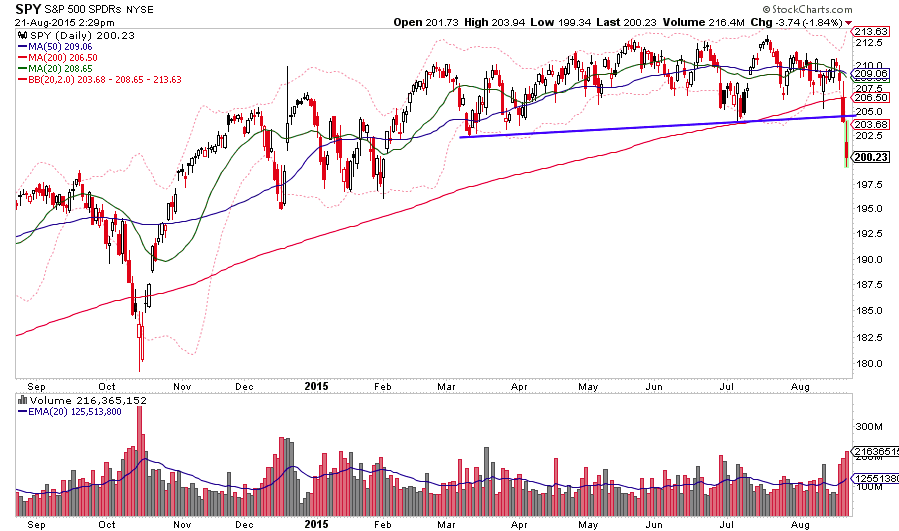
To end the week we saw some market carnage not seen since the last bear market. Friday, sectors and groups across the board crashed into and through key supports. Given the excessive downside breadth on stocks and panic readings on sentiment measures, it’s an interesting bounce setup short term. However, the stock market appears breaking down from a 5 month top.
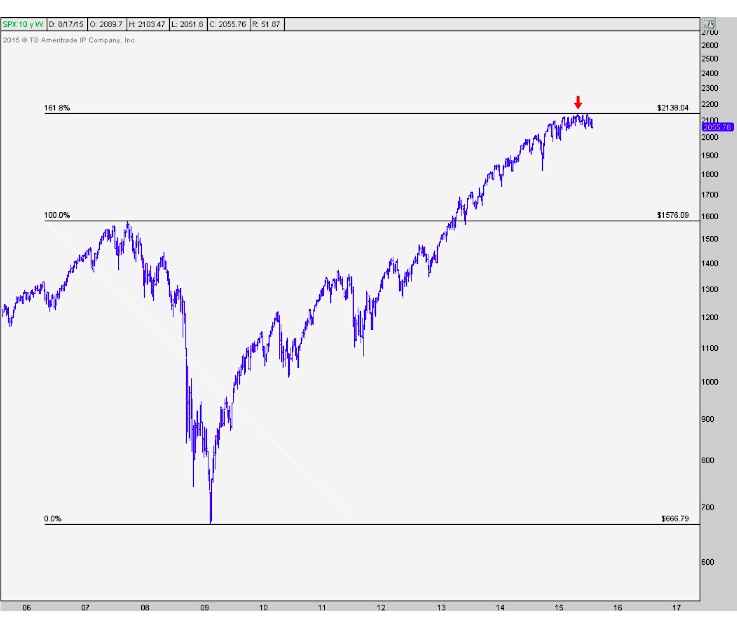
I suggest reading JC Parets piece on the major fibonacci extension ratio in play in the S&P 500. This extension is a level where bear markets can begin. It pays to be protective.
We don’t have a single clear, in-your-face reason for investors to sell (think about when we had Greece to blame). If we can attribute a cause to the sell-off, it’s easier psychologically for trapped longs to sell. Instead, it seems we have confusion with a confluence of factors (china, oil, the Fed) and confusion tends to lead to more hope and less action.
The main attraction to buyers here seems to be the hope that this is just a big panic out of the recent range. This decline is too violent for that and the big picture suggests a continuously deteriorating environment for stocks. But we’ll see how it shakes out in the weeks ahead.
So why am I even talking about buyers? As you know, the downside momentum in emerging markets and commodities has been RELENTLESS. The U.S. markets are just now getting a big whiff of that selling pressure. It’s times like these when ‘trader bros’ become ‘I used to trade bros’. So we have to be careful.
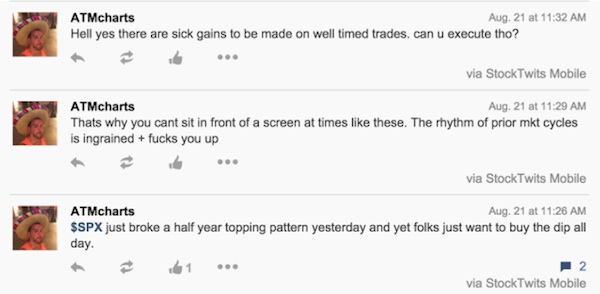
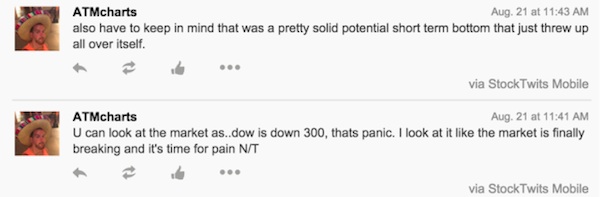
I made a few important points on stocktwits Friday Morning. Remember to read them from the bottom up.
After many years of the same market conditions, we become wired to react to them. Then, markets change and that completely blows up in our face. Guess what, all sorts of algorithms are programmed the same way. It’s another reason to be fearful of further STRONG selling. The key is to just know when the environment has changed.
After the mega bull run in stocks and the massive trading gains seen, it’s easy to get cocky. We tend to think we can accurately trade short term bounces, but that is not always the case!
The whole point is things have just NOW broken down from long term formations. Early is wrong and it can be painfully wrong. If everybody is looking for a bottom or to play a bounce, you’re not going to find it easily…
Thoughts aside let’s stay agnostic for the chart/group analysis.
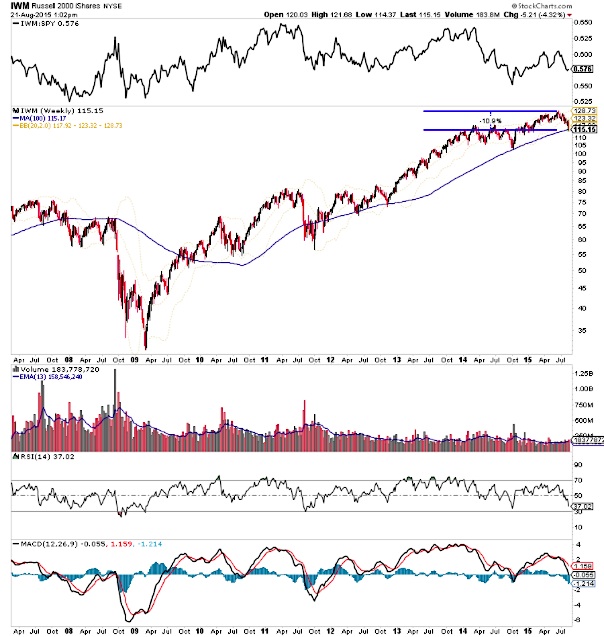
Say you think the market is near a low and you want to buy an index. Which do you buy? The Small Caps look interesting but Monday may put a dent in that. Note we’ve already seen a double digit correction there.
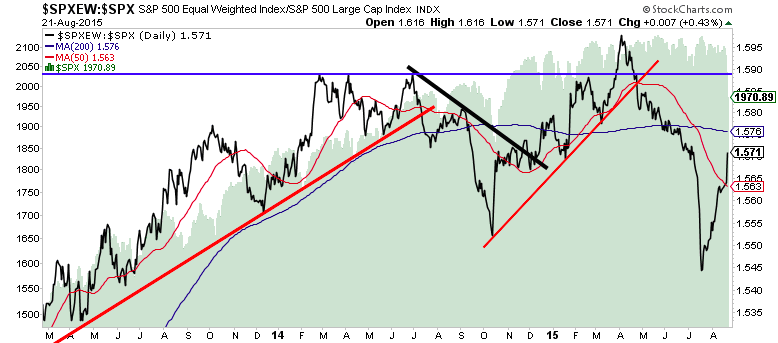
Equal Weight S&P 500 has ripped during this collapse. It seems like a massive positive divergence, but we can’t act on this alone.
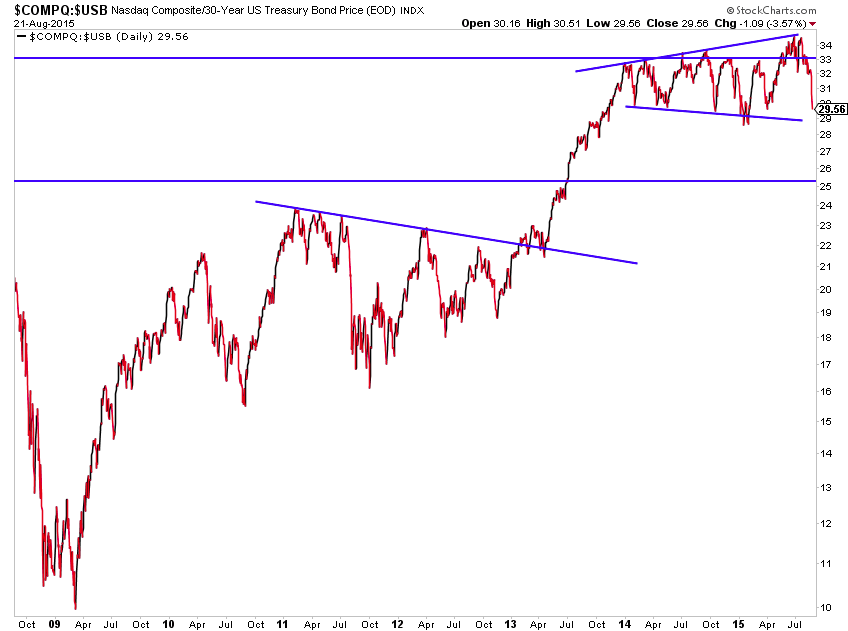
The NASDAQ to Long Term Treasuries ratio continues to megaphone out and is near key support.
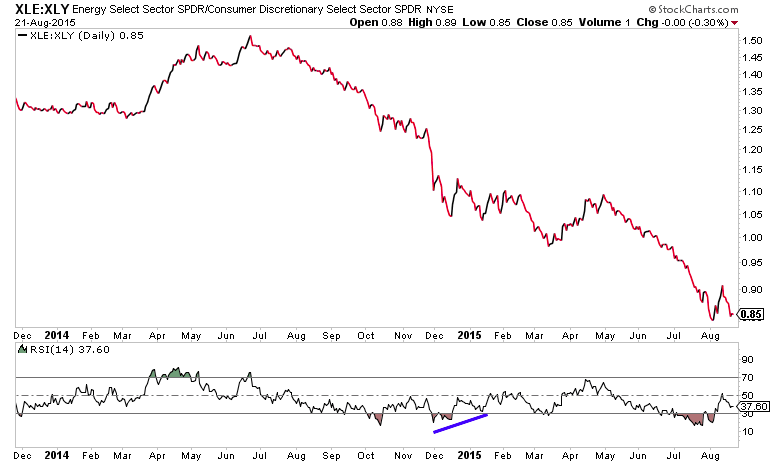
Lastly, let’s take a look at the Energy Sector (XLE) and an interesting ratio chart to Consumer Discretionary. Energy is starting to outperform Consumer Discretionary (XLY). It’s not really that surprising when you consider gas prices. I’d be real wary of the consumer discretionary group and stocks here though.
Have a great week and trade safe.
Twitter: @ATMcharts
Read more from Aaron on his blog.
No position in any of the mentioned securities at the time of publication. Any opinions expressed herein are solely those of the author, and do not in any way represent the views or opinions of any other person or entity.

")


