As soon as the markets kicked off on Monday, the Greece contagion scenario came off the table. And immediately the markets were off to the races. Interestingly sentiment remained negative most of the week with the NAAIM index actually falling. This is a big sign that the negative disposition of market participants (that is a staple of bull markets) is still present.
Let’s review some charts and see what’s happening. As well, be sure to check my latest link-fest for some great reads.
Inside the Market
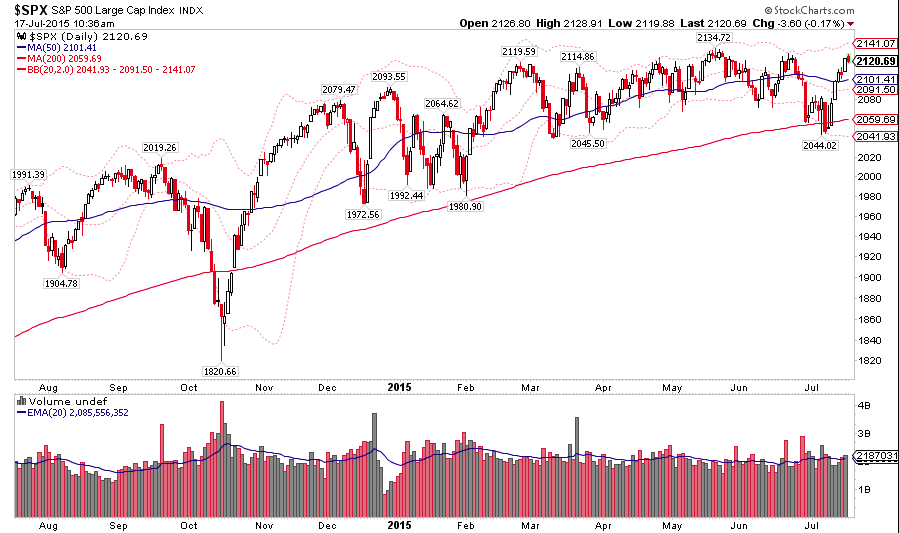
The S&P 500 closed the week back at a major resistance zone. It seems like the odds are this will eventually break higher, but this area is VERY important. A breakout and hold above would have such big implications you don’t really need to jump the gun on macro positions just yet… particularly with earnings season ramping up. Everyone is watching the S&P 500 highs.
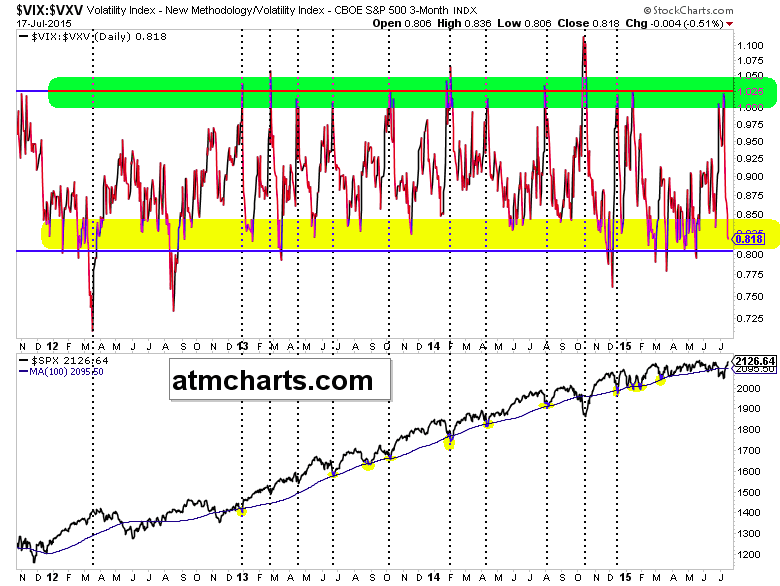
Looking at the fear gauge, the VIX/VXV ratio has gone from fear to nearly fearless in just over a week. Incredible.
The theme of the week I’ve tried to preach on twitter is ‘Buy ’em big and buy ’em sexy’. Here’s a couple reasons why:
Josh Brown notes a shift in fund flows to actively managed funds. Aggression levels are picking up.
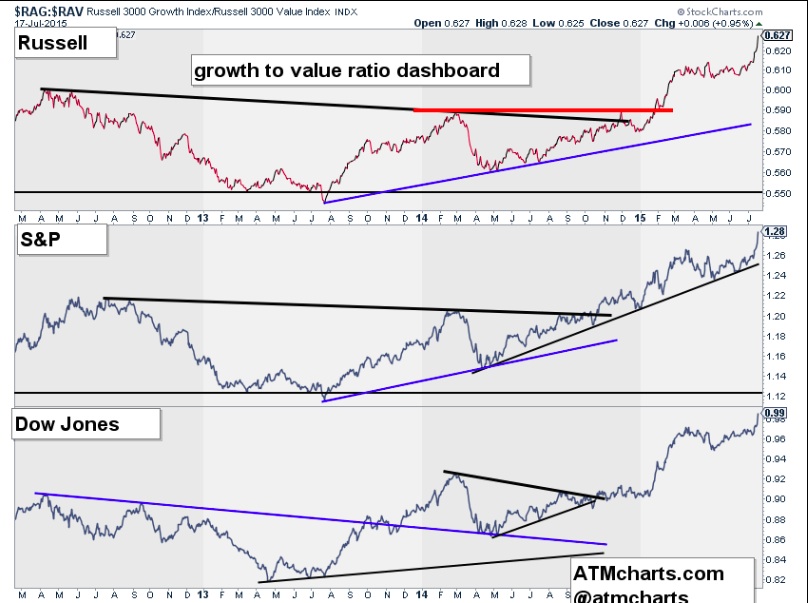
Growth names relative to value are performing exceptionally well and breaking multi-month ranges to new highs across several major stock market indices.
Sector Action & Other Markets
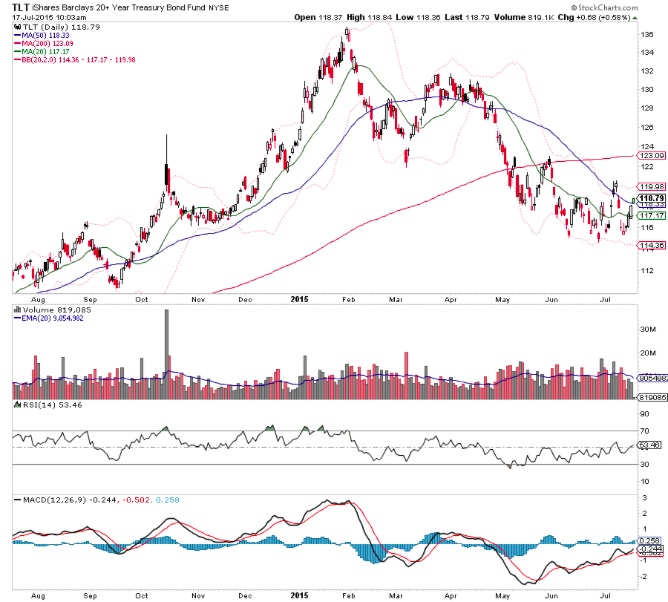
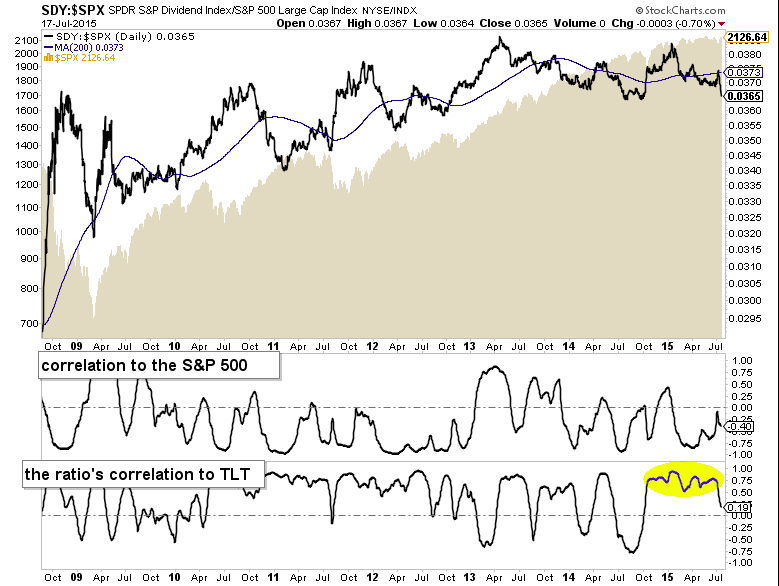
Is the iShares 20+ Year Treasury Bond ETF (TLT) forming some sort of a bottom? The TLT closed back above its 50 day moving average on Friday.
What makes the next chart really interesting is how dividend names have lagged the market notably during this rip. That’s a pretty sharp move lower.
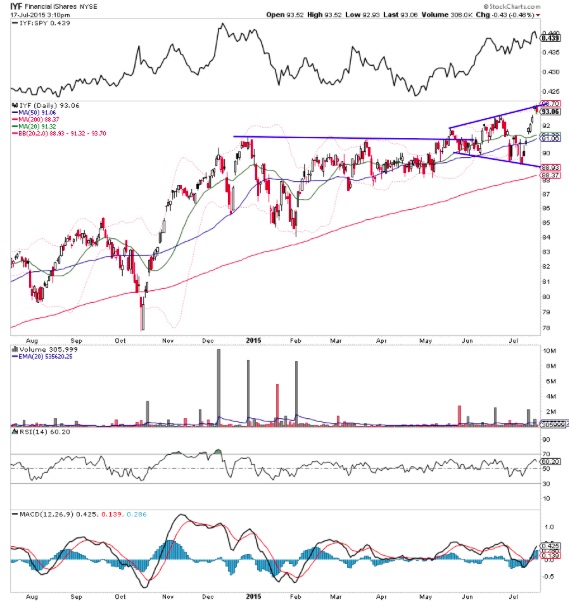
Financials via the Financial iShares (IYF) are broadening out. It appears the most recent decline was a false break of the trendline dating back to 2009, which suggests this group could see a big move to the upside.
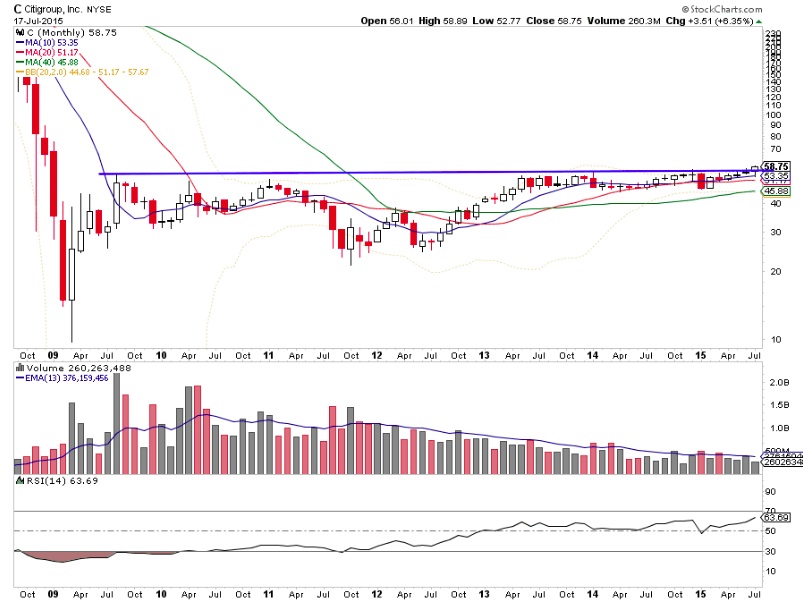
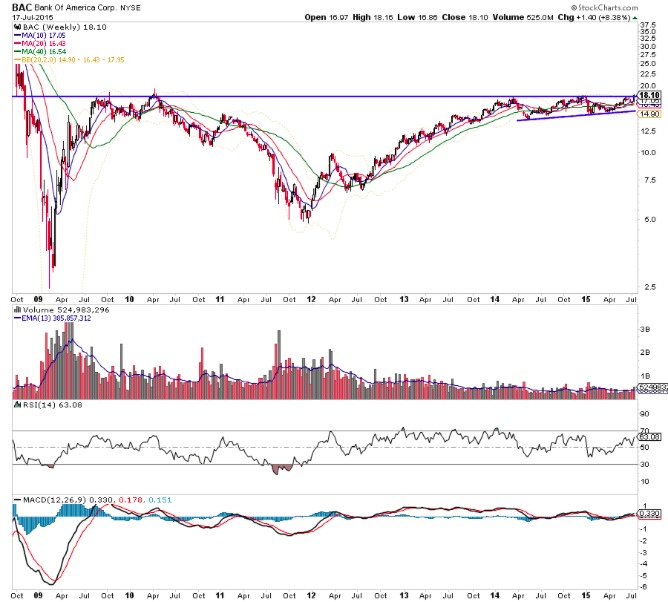
Are Citigroup (C) and Bank of America (BAC) becoming must own stocks for the rest of the year and even into 2016? I’m watching for follow through.
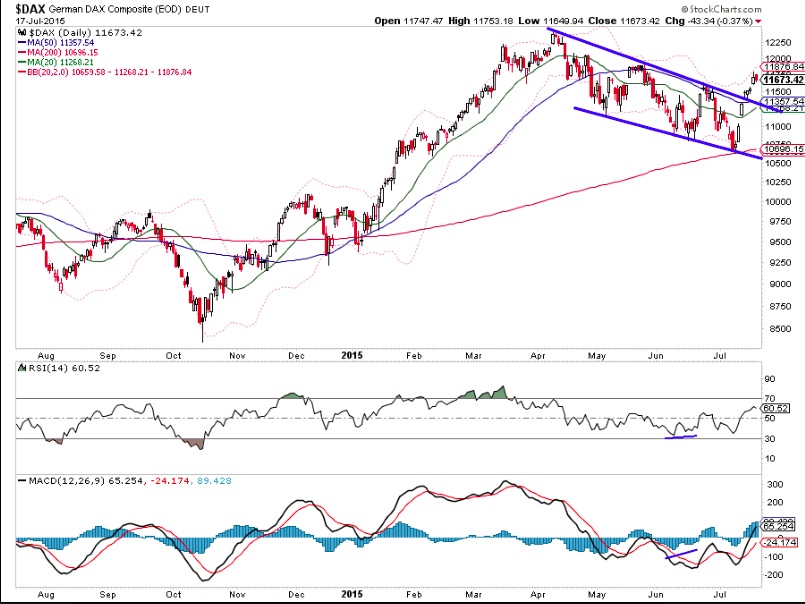
Turning to the global markets, the German DAX market has broken it’s falling channel. Traders can expect the 12000 level to be an important resistance level for German stocks.
Thanks for reading and have a good week.
Twitter: @ATMcharts
Read more from Aaron on his blog.
No position in any of the mentioned securities at the time of publication. Any opinions expressed herein are solely those of the author, and do not in any way represent the views or opinions of any other person or entity.


")


