There has been a lot of noise made about various stock market sentiment statistics showing a rush out of stocks. Whether it be fund cash levels, small futures trader positioning or the NAAIM numbers, it sounds like many traders are trying to make contrary arguments. It’s the same dynamic, just the opposite of what we see at the start of new market uptrends. Frank Zorrila wrote an awesome post to this point.
The developing intermediate-term market trend is lower, and we very possibly have just ended a corrective rally in stocks. It’s easy to over-think, but the risk is clearly to the downside.
For numerous reads on Fed announcement implications and major moves setting up in the markets, check out this week’s “Top Trading Links“.
U.S. Stocks
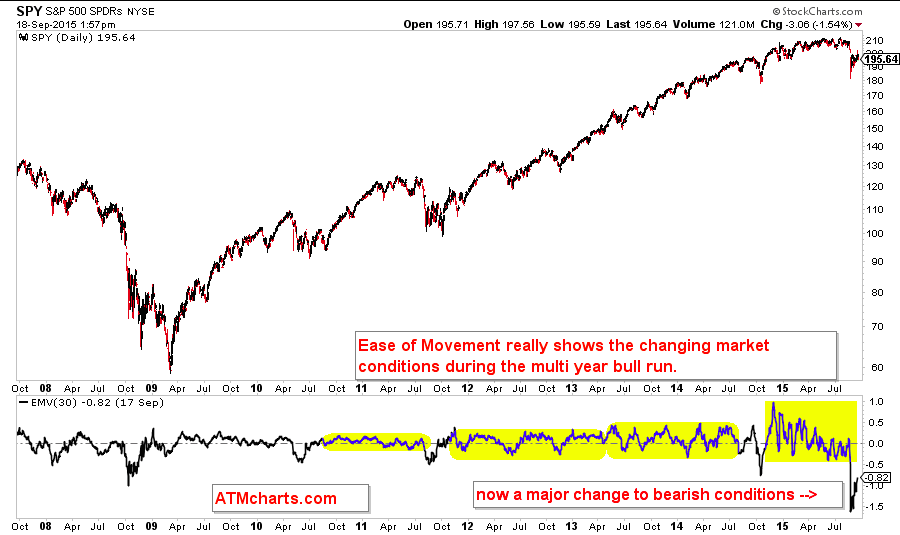
One indicator worth pointing out on the S&P 500 is the ease of movement indicator. The market is moving lower much more easily than it is higher. The velocity of the recent drop is much worse than anything we saw during the Financial Crisis. So that’s interesting.
What do I make of it? This is a dangerous market IF it rolls below short term trend support. Below are long and short term charts of the S&P 500 ETF (SPY).
Here’s a look at that short-term trend support line. Below that and a “retest” of the lows is likely coming.
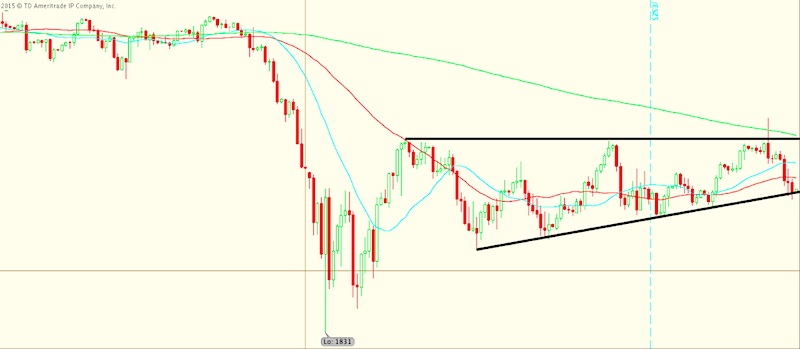
The other day I shared this post explaining why this ascending triangle breakout was high risk.
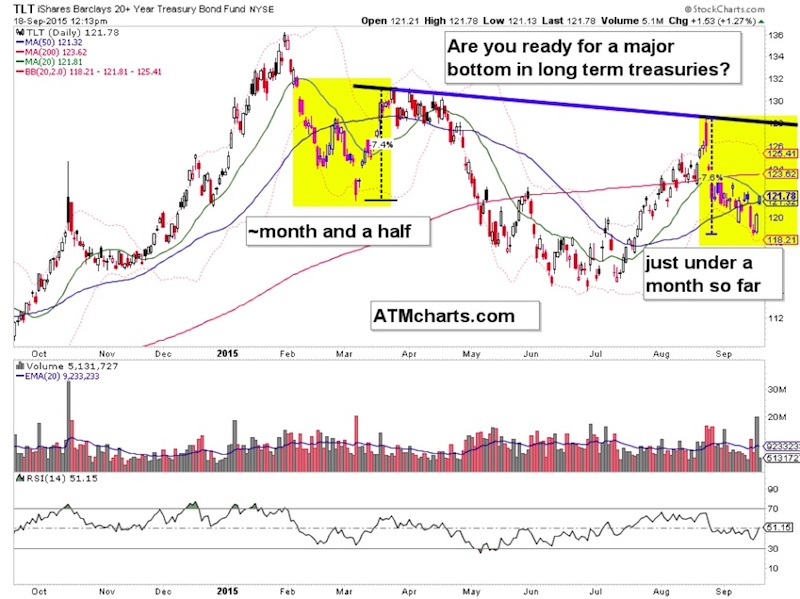
Are you prepared for a major move higher in long term treasuries? Maybe you should be. There could be a monster bottom forming here on the 20+ Year Treasury Bond ETF (TLT). It’s no given and YES it’s jumping the gun, but sometimes you have to jump the gun in scenario based planning. The symmetry is excellent.
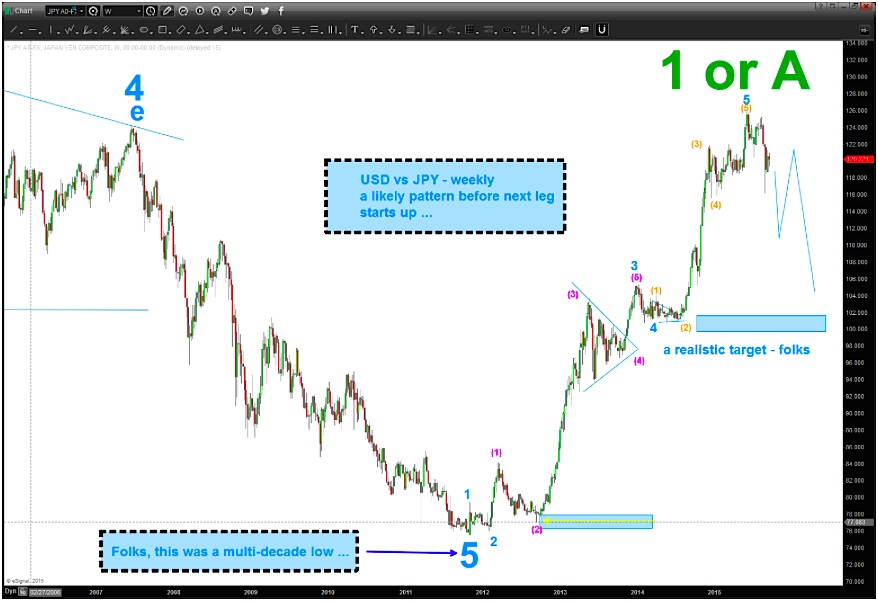
The Dollar Yen is set for a huge move. And this will likely influence the direction of US stocks.
Here’s a look at the USDJPY from @BartsCharts . Read more of his great work on the Yen:
I’ve mentioned on twitter that I built a short position in semiconductors.
continued reading on the next page…


 Ready To Break Out?")
")


