The S&P 500 futures (ES_F) chart offers the same support and resistance levels as yesterday as sideways action prevails into FOMC and OPEC meetings ahead. The markets are certain to expand in one direction or another in the near term. Perhaps seasonality will hit the broad markets but the move in October was so strong, it is unclear whether the market has the strength to propel to new highs.
Divergence remains negative- and the rejection yesterday as the chart stretched upward was textbook.
Range based trading techniques are best in this environment. Buying support remains strong at key levels.
Near term S&P 500 futures support still lies beneath near 2080.5 region and near term resistance near 2098 region. Because we are range bound, breaches on either side of those levels and return to the channel. Steep pullbacks remain buy zones rather than breakdowns unless there are news events that make the markets particularly nervous.
Shorter time frame momentum indicators are neutral, and lower than Monday. Longer cycles are still bullish, but momentum is weakening upside. Most indicators on longer time frames at this point show buyers still in charge, but their strength is not aggressive.
See today’s economic calendar with a rundown of releases.
RANGE OF TUESDAY’S MOTION
Crude Oil (CL_F)
Oil lost support of 42.4, and now sits in a bit of a bearish stance with neutral momentum. OPEC meetings are clearly in view here – but the Saudis surely won’t bend. They have nothing to lose and everything to gains at the end of the game. Currencies likely will make for lower levels as well. Secondary support zone is near 41.45. The breakout region is still 42.54 for the upside, and now 41.45 for the downside today. A hold and retest of 42.37 sends us near 42.7, then 43.1 and perhaps into 44 if the range expands based on rumor and such. Breakdown below 41.45 sends us to 41.18, 40.85, 40.14, and 39.9. Momentum on short time frames is mixed. See premium blog for tighter levels.
S&P 500 Futures (ES_F)
Chart Key Levels For The Week
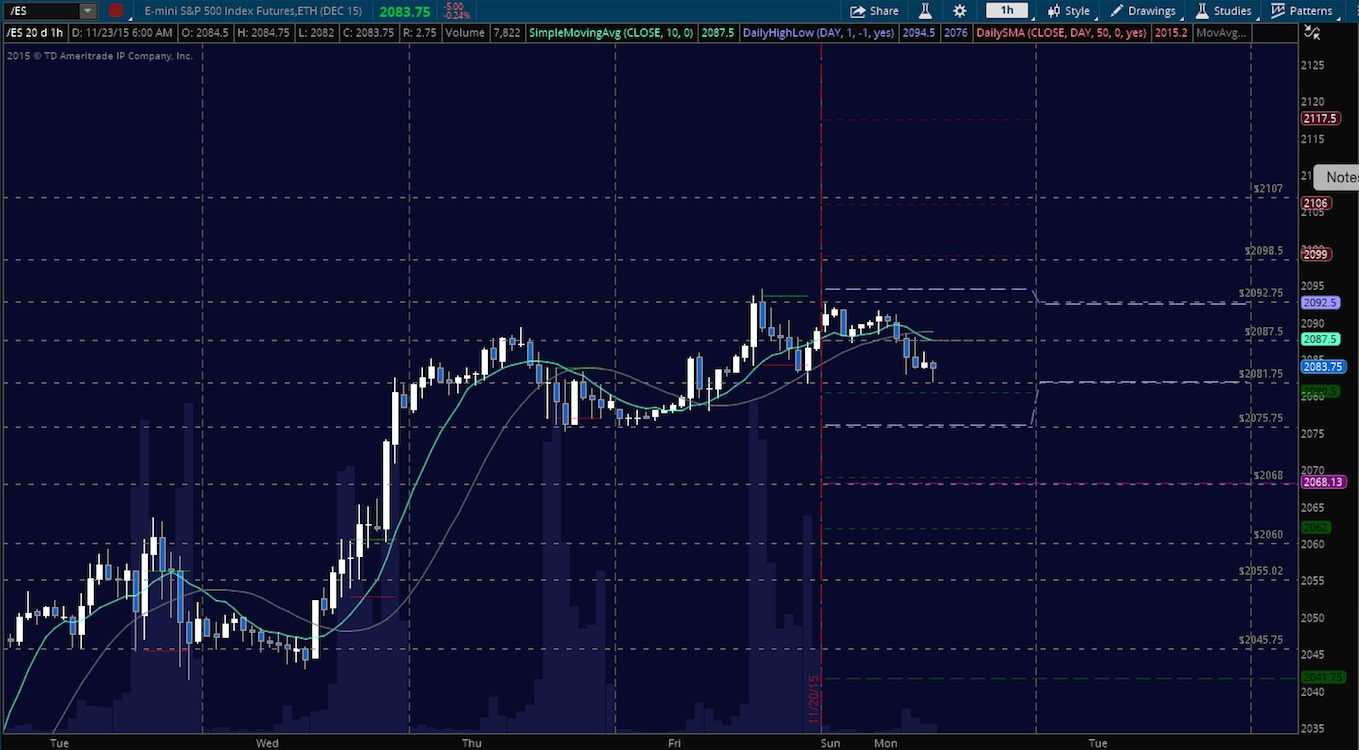
Upside motion is best setup on the bounce off the support line near 2086.5. Congestion support lies at 2085. If the buyers have limited power, the chart will fail to breach and hold 2092.75. Momentum is flattening from bullish action on tighter time frames, and negatively divergent on larger time frames of reference. A hold of 2086.75 should deliver 2089.75, 2092.5, then 2094.75, 2096.25, 2098.25, and with a breach potentially 2099.25, and 2100.25 as targets longer term.
Downside motion below the failed retest of 2085, or at the failure to hold 2089 opens a short (watch momentum on tight time frames- that would be an aggressive short). [BIG PICTURE NOTE => Short trades should be staged into S&P 500 futures support and then cautiously watched after some profit is taken, until we fail 2045 on a retest- that level represents a very strong buying support zone and will keep the chart essentially bullish on larger time frames.]
Buyers are still in charge, though patterns look very tired. Retracement into lower levels from 2089 give us the targets at 2086.75, 2085.75, 2083.5, then 2081.25, 2080.5, 2078.75. Expansion levels can be found in the Platinum Level protected content.
As long as the trader keeps himself aware of support and resistance levels, risk can be very adequately managed to play in either direction as bottom picking remains a behavior pattern that is developing with value buyers and speculative traders.
Thanks for reading.
Twitter: @AnneMarieTrades
Any opinions expressed herein are solely those of the author, and do not in any way represent the views or opinions of any other person or entity.
")


