What if I told you the Japanese Yen is the most heavily long-term oversold it has been in a generation?
In the post-WWII era, the Yen was pegged at a fixed exchange rate to the US Dollar at a ratio of 360:1 (so $USDJPY 360) beginning in 1949. After the collapse of Bretton Woods, JPY began floating freely against the Greenback in August 1971.
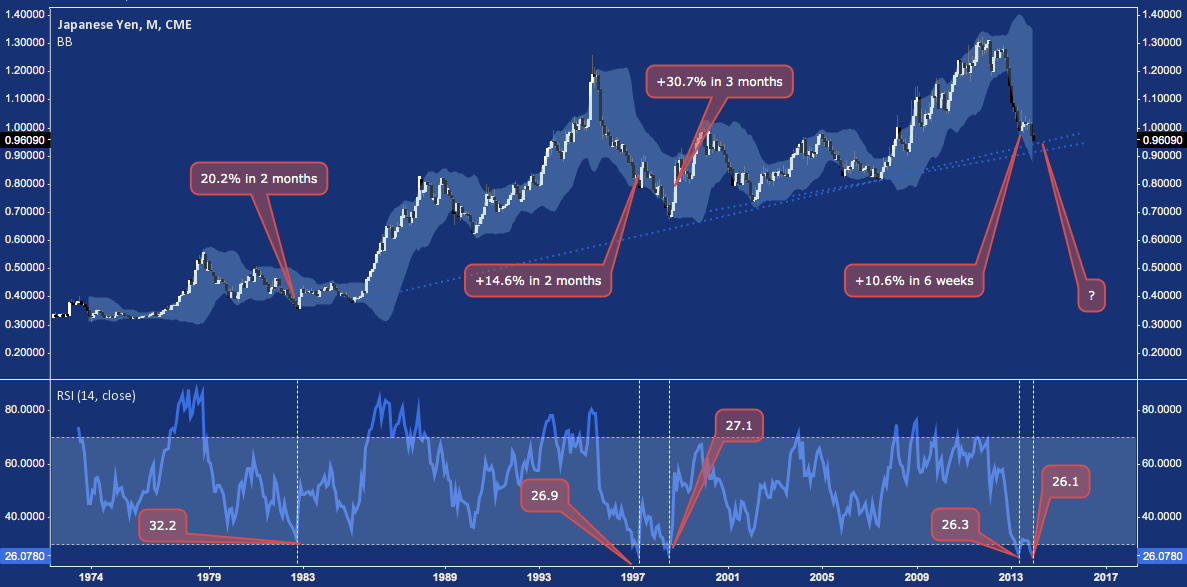
Since then, the continuous CME Japan Yen Contract (Symbol: J6) has traded like this:
Whether the Yen is setting a record is of secondary importance. As an active investor and trader viewing a monthly chart, I am interested in completely the first major step in my process of analyzing an asset class: defining context. Once this basis is firmly established, it can inform all analysis and potential setups nested inside it.
Here are a few basic and current observations in which I locate all other analysis and opinion about not only J6, but all Yen Crosses (USD/JPY, GBP/JPY, EUR/JPY et al.), Japanese equities and Japanese sovereign bonds (JGBs).
- J6 is approaching or at secular rising trend line support off its swing 1985, 1998, 2002 and 2007 lows.
- The momentum of J6‘s drop since its high near 1.30 in latter 2012 is moderating, with price holding above it’s lower Bollinger Band after sliding along it for most of the last year.
- According to the 14-period RSI (bottom panel, above), the Yen has never been more deeply oversold than it is today. Other bounded momentum oscillators like this may not provide a historic, post-Bretton Woods-era reading; but it is very close. Moreover, periodicity (e.g. a 14-period RSI looks at the last 14 months) makes a negligible difference: even on a 100-period RSI, the relationship of the current reading relative to the 1982, 1997, 1998 and May 2013 lows remains intact.
- These low RSI readings have not historically produced grinding regimes. In each case, the dip <30 (considered “oversold”) has been met by a swift rally.
- The average long appreciation of the Yen following a RSI print ~30 or below is 19.02%
- This average long appreciation occurs within 90 days following the RSI print.
This all adds up to a very challenging environment for initiation of anything banking on a profitable short Yen program, particularly given the 2007-like, pre-carry trade unwind extremes the CFTC’s Commitment of Traders reports on J6 futures positioning.
This leads to a few higher-level observations and inferences:
- On the Carry Trade: Long JPY Cross trades – some of which are legitimate carry trades, especially among exotic crosses (e.g. ZAR/JPY) where overnight interest rates are higher than the ZIRP-entrenched G10 presents – are highly extended. Any hint of an ill wind from a host of catalysts (note: these are not always – or even usually – immediately apparent!) could easily tip this house of cards over.
- On Japanese Stocks: The J6 and Japanese Nikkei 225 (NKY) have a TTM monthly negative correlation of -0.925. This polarized regime between currency and stocks hasn’t always been so; and no doubt the day will come when their almost flawlessly inverse relationship will revert to something more dynamic. But for now: when the Yen goes up, the Nikkei goes down. Given that the Yen is historically oversold and possibly threatens a swift double-digit pop higher, the comparably-crowded long Japanese equities trade (substantially funded by the dirt-cheap and rapidly-depreciating JPY) could likewise be at risk of a major setback
- On US and European Stocks: if JPY-funded carry is driving Japanese stocks higher, it is also adding fuel to the long US and long European equities trades. This, to some degree, is why the likes of EUR/JPY and AUD/JPY (though neither are classic carry trades at current rates) track the S&P 500 and DAX so closely. In the era of “The Recovery” (as Ben Bernanke likes to refer to it), ever cheaper and constantly hammered JPY means ultra-cheap risk funding. In other words, the scope here isn’t limited to Japanese equities. A major, forced JPY short covering event would have implications for US and European stocks, also.
- On the Bank of Japan/Abenomics: The BoJ makes this time different; right? Don’t battle the Bank of Japan. This is a major reservation and must be acknowledged; but don’t overdo it. The Bank of Japan has overseen QE before in the last 42 years; and with a glance at the chart above, not where the Yen’s performance would lead you to believe. Perhaps it’s apples and oranges, though, because Abenomics wasn’t a thing and the scale of accommodation was modest by comparison? While that’s only sort of right, one need look back no further than May 2013 to realize the Yen can appreciate substantially in the current context. Whether or not the BoJ actively seeks to debase its own currency – it certainly doesn’t have a problem with it – it’s implicit short Yen bias is not infallible. Those who are convinced it is are engaged in a highly risky bet. While it may prove correct in the long run, a 10-20% nominal move to the upside for JPY – something the BoJ has already done whatever it can short of naked, sustained FX intervention – would prove devastating to these parties (some of whom are highly levered). J6, CoT and equity prices among other metrics argue this may be right around the corner.
Twitter: @andrewunknown and @seeitmarket
Author holds no exposure to securities mentioned at the time of publication.
Chart provided courtesy of Tradingview.com
Any opinions expressed herein are solely those of the author, and do not in any way represent the views or opinions of any other person or entity.


")

 Rolling Over At Key Fibonacci Level?")
