The graph below shows 7 year averages of the Federal Reserve’s potential economic growth vs. actual growth to show the simplicity of the Fed’s potential GDP forecast. Not surprisingly forecasted GDP growth for the next 10 years follows the economic growth trend of the last 10 years.
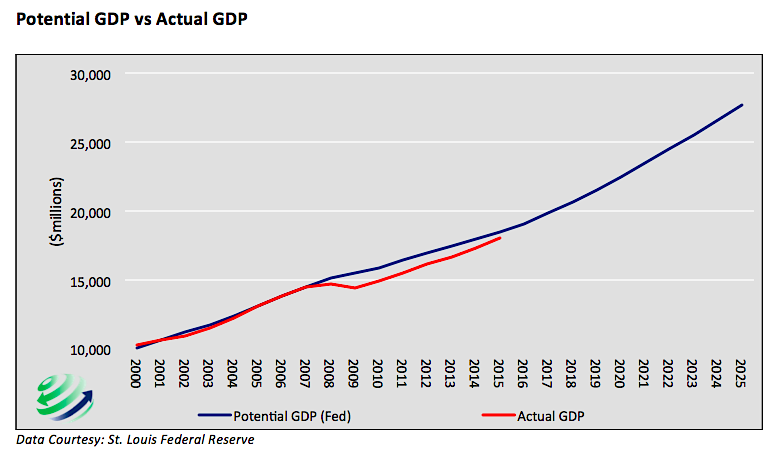
Unfortunately, one must understand that potential GDP, as measured by the Fed, is not fully factoring in the limited ability to continue to increase debt loads, the demographic headwinds and the fact that productivity growth could likely be negative in the years ahead. The Fed’s measure of potential economic growth is solely a function of past activity and the different environment that produced it.
To better explain the problems of following a faulty trend we compare 2 trends based on baseball legend Barry Bonds career statistics. During Bond’s peak playing years from ages 24 to 35 he posted outstanding statistics which likely would have earned him a seat in Cooperstown. Bonds batting average was consistently .300 or above, as seen below, and he averaged 36 home runs per year during those years. Following his peak years, when most players’ performance drops considerably, Bonds somehow got even better. From ages 36 to 40 his batting average and home run production exploded. During this time frame, Bonds averaged 51 home runs per year. This included his 2001 campaign when he hit 73 home runs, topping Mark McGwire’s then 3 year old record of 70 homeruns and shattering what had been the previous record, Roger Maris’ 61 homeruns in 1961.
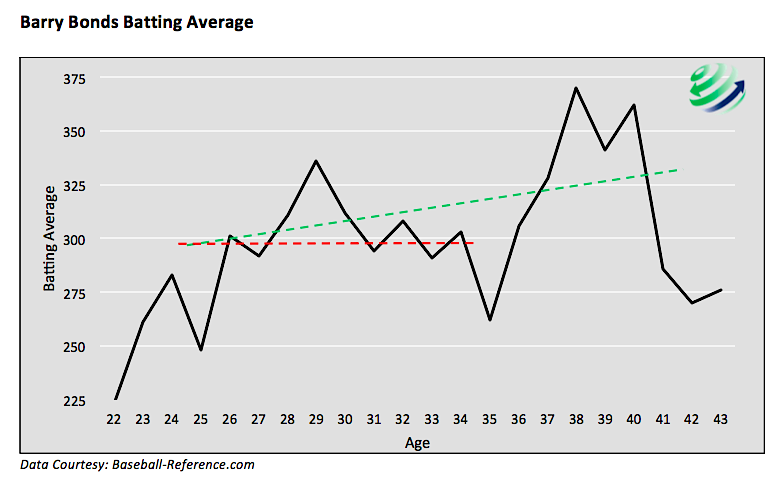
As we now know, this incredible feat was not based entirely on his natural potential but was greatly aided by a new factor, steroids. The red and green lines above show 2 potential trend lines that could be used to summarize his performance. The red line represents Bond’s relative consistency during a typical professional players’ peak years. The green line shows the effect that steroids had on boosting performance and extending his career, or the deviation from typical potential. The gap between the trend lines is significant and could easily lead one, unaware of the new factor, to arrive at vastly different conclusions i.e. that Bonds had found some secret to increasing his productivity at a time when the typical player of similar age was declining or retired.
Basis for Monetary Policy
Fortunately, monetary policy is not based off tainted baseball statistics. However, like in the Bonds example, there are new and changing factors in an economy that alter its potential growth rate. By failing to consider these factors and how such factors could alter their benchmark, the Fed runs the severe risk of conducting inappropriate monetary policy.
The following graph illustrates how an erroneous potential growth rate would greatly change the Fed’s perception. Assume the true annual potential growth rate since 2000 was 0.50% less than the official Fed potential growth rate. Under this reasonable scenario, economic growth as measured by GDP (red) would have exceeded the hypothetical potential growth rate for 4 consecutive years prior to the financial crisis of 2008/09 and again over the last 3 years. When actual growth is above the “true” potential of an economy, the economy is pulling forward consumption from the future. When the future comes consumption needs have already been met and slower growth is inevitable.
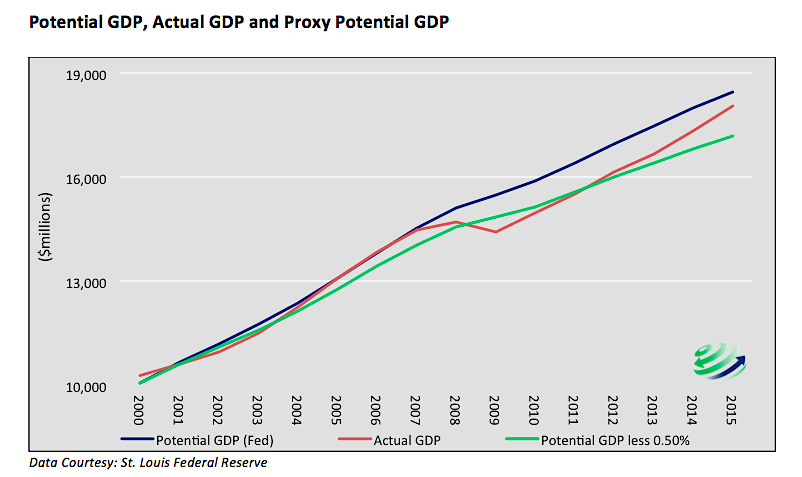
Let us now consider that economic growth has failed to reach the Fed’s measure of potential GDP (blue line) since 2007. This is despite unprecedented stimulus in the form of a zero interest rate policy and the quadrupling of the money supply. One must question whether or not the target is correct. Maybe the so called “new normal” sluggish economic growth is the economy’s real potential and not the higher growth rate of years past.
We believe the potential growth rate is less than that which is targeted by the Fed. To what extent, is unclear. The widely followed Taylor Rule supports our analysis, to some degree, as it currently shows a glaring discrepancy between the current Fed Funds rate (.25-.50%) and that prescribed by the rule (2.92%). If the Taylor Rule and our thesis are correct, the potential growth rate of the U.S. economy may be much lower than the Fed thinks, and therefore monetary policy is not just “accommodative”, as described by Chairwoman Janet Yellen, but egregiously excessive.
The Fed, by chasing an erroneous GDP growth target may have generated economic growth beyond that which would have otherwise been produced by keeping interest rates too low for too long and performing multiple rounds of quantitative easing. These actions increased the Fed’s measure of potential growth, creating a vicious cycle in which they repeatedly over-stimulate to meet an erroneous target. As this continually occurs, the gap between true potential and the Fed’s measure widen, leading to larger and larger policy errors.
Excessive Stimulus is Crushing Productivity
Worse yet, Federal Reserve monetary policy used to promote economic growth relying upon changes in interest rates and money supply to increase debt and drive consumption. Lower interest rates and QE have also spurred a strong preference for speculative investments, such as stocks, real-estate, and junk bonds, at the cost of productivity generating investments. Recent bubbles in technology, real estate, and stock valuations, to name a few, are signs of the speculative fever the Fed’s actions enabled. Low interest rates have also encouraged corporations to use valuable assets or borrowed funds to buy back stock instead of investing in growth-enhancing innovation. Globally, low rates in the U.S. led many investors to borrow in dollars to fund questionable projects over-seas. In other words, trillions in capital has been misallocated with little benefit to productivity growth. While such actions may have caused one-time increases to GDP, they are neither producing sustainable economic gains nor has the debt incurred been paid down.
If we are correct and the Fed is overestimating the potential growth rate, then by default they are also applying excessive stimulus to the economy.
Prescription for Real Growth
There are many reasons productivity growth has stagnated, and the Federal Reserve is certainly not solely responsible. Yet Fed officials, as witnessed by Mr. Dudley’s comments, treat productivity as an uncontrollable residual of capital and labor. They would be well-advised to take a different tack and use their enormous power to have a positive effect on productivity. Without productivity growth, economic growth in the future will be extremely limited as capital and labor cannot contribute nearly as much as they have in the past.
The Fed, along with government, needs to properly incent productivity. The Fed should start this arduous task by removing excessive stimulus which will take the speculative fervor out of markets and allow asset bubbles to deflate. Although painful in the short term, it will allow capital to flow to more economically, productive uses that have been starved of capital. Congress, for their part, should reconsider current Fed mandates and discuss means in which the Fed can incent productivity growth.
Ingenuity, not debt, made America an economic powerhouse. If we are to resume down that path we need the Fed to end their “self-defeating” policies and in its place we must demand ingenuity from them.
Twitter: @michaellebowitz
The author has no positions in any of the mentioned securities. Any opinions expressed herein are solely those of the author, and do not in any way represent the views or opinions of any other person or entity.
")


 Rolling Over At Key Fibonacci Level?")

