Three and a half years have passed since Gold peaked at $1923.70 per ounce, reminding investors that the other side of exuberance can be painful. The Gold bear market is finally beginning to take the wind out of Gold bugs sails, as a series of fits and starts have lead to a year full of sideways to lower grinding action. And with Gold hitting 1142 yesterday, investors and market onlookers are now turning their focus to the 52 week lows at 1130.
Failed rallies are the hallmark of any bear market. And even if a rally sticks around for more than a few weeks, it’s really nothing more than a “traders” play. This ebb and flow tends to take the “belief” out of the believers. And it is only when this happens that the Gold bear market will officially die and turn a new leaf, allowing for a new bull market to begin.
But the big conundrum is that no one really knows in real time exactly when “the” bottom presents itself. So it’s very important that investors understand their indicators and time horizons when considering assets that are deeply depressed. In short, probabilities (whether technical or fundamental, or both) must line up with your trading or investment time frame.
Late last year I shared my 2015 Fundamental Outlook for Precious Metals, looking at some potential headwinds and tailwinds for Gold. Headwinds included: US Dollar strength, slowing global economies, deflation fears, and being an out of favor asset class. Tailwinds included: geopolitical tensions, a pullback in the US Dollar, Europe, and sentiment.
The headwinds have continued to weight heavy on the Gold bear market. But the yellow metal is closing in on new lows and sentiment is tanking so it’s probably a good time to evaluate the current setup and present some macro details to get a better feel for the current state of the Gold bear market. Let’s walk through some charts and high level observations.
Grind Them Out With Failed Rallies
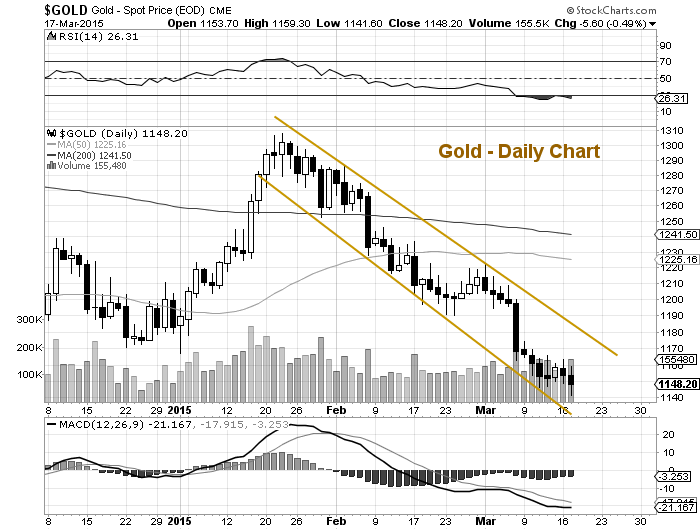
The recent move lower was a great example of a failed rally/opportunity. The gold trade into early 2015 was strong, and occurred in the face of a rising dollar. And this lead to rising “hopes” for Gold bugs. Much of the rally seemed to be based in fear over the situation in Europe and the collapsing Euro. But the rally ultimately failed when Europe announced its bond buying QE program. Why? Two reasons: 1) The announcement accelerated the weakness in the Euro (strengthening the US Dollar) 2) It gave the market what it wanted, eliminating some near-term uncertainty (remember Gold thrives on fear).
So Gold prices fizzled from there, falling over 11 percent from its late January high to its current price around 1148. Note that the retreat has been ‘orderly’ and defined by a tight price channel. So investors are back to square one, still searching for a low.
The US Dollar Factor
Considering the big run in the US Dollar Index (recently eclipsing 100), an argument could be made that Gold has held up fairly well. Fair enough, but it’s also good to realize that the yellow metal is near 52 week lows. So it’s probably best to let Gold prove itself. If/When the US Dollar begins a broader pull back, it could be a tailwind to another rally attempt (perhaps one with a bit more juice). But it’s also important to understand that the US Dollar is in a bull market, so any correction may be short-lived (a few weeks to a few months). And another run higher is likely.
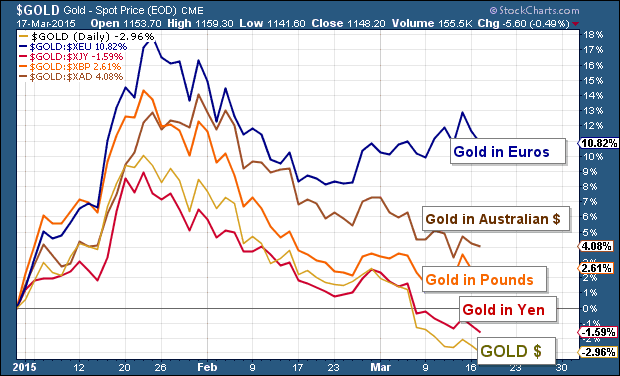
As you can see from the chart below, Gold has performed really well this year in Euros, but not so well in Yen and US Dollar. Hello currency wars.
Sentiment – What It Means?
According to Kitco, The Gold Bugs Index:
represents a portfolio of 20 major gold mining companies.The Index is designed to give investors significant exposure to near term movements in gold prices – by including companies that do not hedge their gold production beyond 1 1/2 years.
So investors can use this Index as a gauge of how the industry (and investors) feel about Gold’s near-term prospects. In short, it’s getting pretty ugly on the old Gold Bugs Index – see the chart below. Note that Sentiment data is often used as a contrarian indicator (i.e. we don’t want to buy when everyone is buying, or vice versa). However, if stretched too far, the rubber band can break and lead to price capitulation.
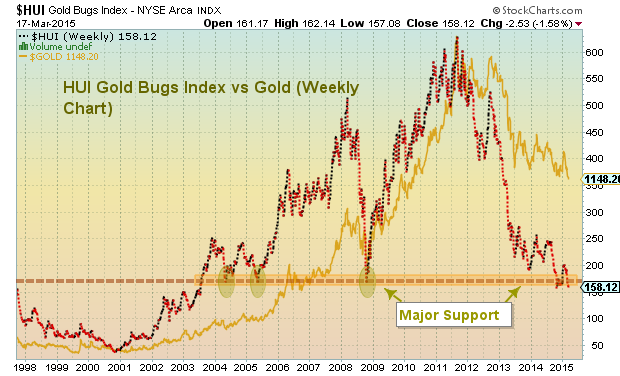
Note how the Gold Bugs Index nearly mirrors the Gold bear market. As well, index is nearing a big support area between 150 (the low tick of the 2008) and 165 (the lows of May 2004 & May 2005). Keep an eye on this. The recent downward draft also coincides with poor springtime seasonality (especially March).
Understanding this, active investors should be on the lookout for a near-term seasonal bottom.
How Low Can We Go?
The Gold bear market has taken the yellow metal down by more than 40 percent thus far. But that’s nothing if you look at the likes of Crude Oil (which has fallen 6o percent in 9 months). Remember, you may be right over a longer time frame, but the market doesn’t owe you anything right now. Know your time frames.
Here’s a “macro” view of the bull market and subsequent bear market on a log scale chart.
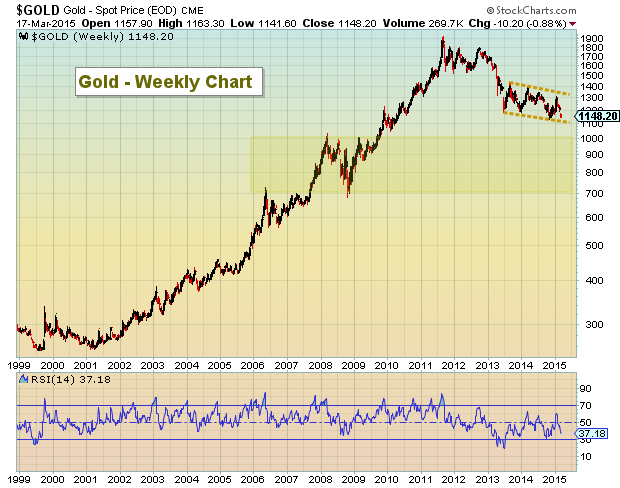
A move below 1130 would be a caution flag, but I won’t get overly excited about a major bottom until Gold breaks 1100 and we see another bout of capitulation (whether that’s this year or next). Some potential targets include the 50 percent retracement of the bull market at 1088 and a 61.8 percent retracement at 890. An extreme low would be around 700-750 (the 2006 high/2007 breakout/2008 retest).
What’s The Takeaway?
With The US Dollar over 100 and poor sentiment/seasonality aligning, Gold may be setting up for another tradable bottom. But it remains to be seen whether or not Gold will offer up the traditional “whites of the eyes” capitulation bottom this year. Thanks for reading.
Follow Andy on Twitter: @andrewnyquist
No position in mentioned securities at the time of publication. Any opinions expressed herein are solely those of the author, and do not in any way represent the views or opinions of any other person or entity.


