The following is a recap of The COT Report (Commitment Of Traders) released by the CFTC (Commodity Futures Trading Commission) looking at futures positions of non-commercial holdings as of October 6, 2015. Note that the change is week-over-week.
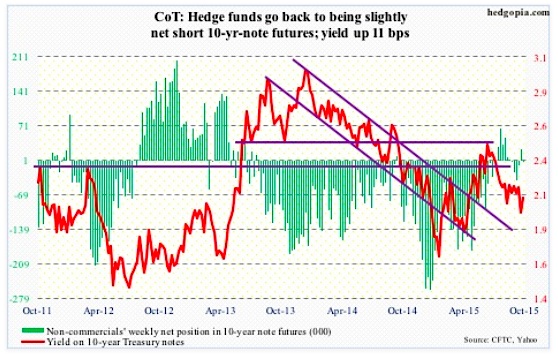
10-Year Treasury Note: Since the September 16-17 FOMC meeting, barring comments from hawks like John Williams, president of the San Francisco Federal Reserve, and Dennis Lockhart, president of the Atlanta Federal Reserve, most Fed officials’ message has leaned dovish.
Minutes from that meeting, released Thursday, were no exception. With one difference maybe. It seems they are now focused more on inflation than on employment. But who knows? The message keeps shifting, and will probably do so again. Honestly, it is not clear what exactly they are looking at. But if the emphasis really is on inflation going forward, we may not see a rate hike for a long time to come.
With the 10-year yield continuing to hover at two percent, history was made on the shorter end of the curve this week. On Monday, the U.S. Treasury sold three-month bills with a yield of zero – for the first time on record. In the secondary market, some bills have been yielding slightly below zero or around zero for weeks. For instance, on Tuesday morning, the yield on three-month bills turned negative briefly.
Rather fittingly, the IMF once again trimmed its global growth forecast to 3.1 percent for this year versus 3.3 percent in July.
Does Narayan Kocherlakota, president of the Minneapolis Federal Reserve, then have a point suggesting the Fed should resort to negative interest rates? Probably not. Why would negative rates help the economy if rates at/near zero for seven years have not already? It will only look desperate, as if the Fed is grasping at straws.
October 6 COT Report: Currently net short 2.5k, down 25 k.
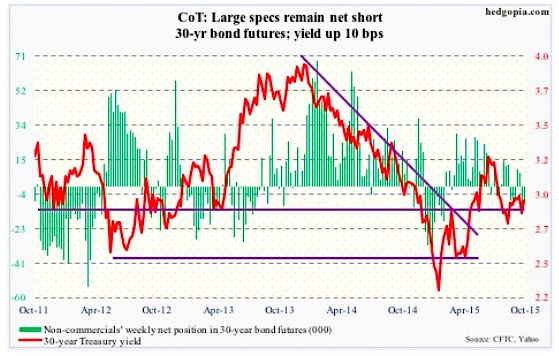
30-Year Treasury Bond: Next week’s major economic releases are as follows.
On Tuesday, we get the NFIB small business optimism index, which in August rose 0.5 to 95.9. The December (2014) reading of 100.4 was the highest since 100.6 in October 2006. Comp and capex plans in particular remain subdued.
September’s retail sales come out on Wednesday. They rose 0.2 percent in August, but momentum has been slipping – down four of the last nine months.
Also on Wednesday, September’s producer prices will be published. In July, they were flat. In the 12 months through August, the PPI fell 0.8 percent.
CPI is on Thursday. Consumer prices slipped 0.1 percent in August – the first decline since January. In the 12 months through August, they rose 0.2 percent. Core CPI rose 0.1 percent and 1.8 percent, respectively. This was the fifth time in six months that core CPI rose at a 1.8 percent clip. The CPI is not the Fed’s favorite measure of consumer inflation. The PCE price index is, which is not running as high as core CPI. Core PCE rose 1.3 percent in August.
Friday has four different releases: industrial production for September (capacity utilization of 77.6 in August, down from cycle high 79 last December); JOTLS for August (job openings of 5.75 million in July – an all-time high); the University of Michigan’s preliminary reading of consumer sentiment for October (87.2 in September, down from cycle high 98.1 in January); and the Treasury International Capital System for August (China held $1.24 trillion in Treasury securities in July, down from $1.27 trillion in June).
Six FOMC members are scheduled to speak during weekdays.
October 6 COT Report: Currently net short 7.1k, down 1.9k.
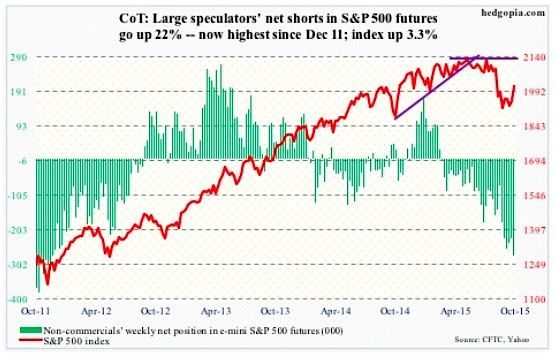
E-mini S&P 500: Back on September 17, stocks sold off after the FOMC statement was released. It was considered too dovish. On Thursday, minutes of that meeting were made public, and they were as dovish. Yet, stocks rallied. Confused yet? Technicals probably had something to do with it. Back then, daily technicals on the stock market were getting a little too stretched. This time around, there was still room left before they got overbought.
In the process, the S&P 500 Index has pushed above its 50-day moving average. And one can argue that with a move past 1995ish we now have a double bottom. Before we get too excited, right above lies resistance at 2021, followed by a major one at 2040-2060. The 2021 level already acted as resistance for stocks on Friday, with the session producing a doji.
Off the September 29th low, the index has already rallied 7.6 percent. That is in eight sessions. Too soon, too fast? Probably why non-commercials are not buying the rally. They added to net shorts, which are now the highest since December 2011.
And retail is using the rally as an opportunity to lighten up on stocks. Through Wednesday, domestic equity funds reported net outflows of $3.7 billion (courtesy of Lipper).
October 6 COT Report: Currently net short 278.2k, up 50.6k.
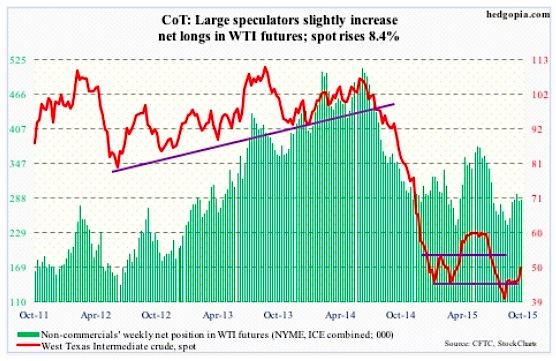
Crude Oil: Over the weekend came the news that Saudi Arabia would cut the price of its light crude oil deliveries to Asia by $1.7/barrel. It also cut its heavy-oil prices by $2/barrel to the Far East and by $0.30/barrel to the U.S. Come Monday, crude oil traded just fine. Are traders beginning to focus long-term?
OPEC secretary-general said global investment in crude oil will drop by $130 billion this year, which has to impact supply in due course.
Right here and now, inventory continues to rise. In the October 2nd week, U.S. crude oil inventory was up another 3.1 million barrels, to 461 million barrels – up seven million barrels in two weeks. Gasoline stocks rose 1.9 million barrels, to 223.9 million barrels – now up 11.1 million barrels in the past seven weeks. Gasoline was at a similar level in the middle of May – right before the summer driving season; days of supply currently stand at 24.8, vs. 22.2 in the August 14th week.
In the meantime, refinery utilization continues to fall – down 2.3 percentage points to 87.5 percent and down 8.6 percentage points in the past eight weeks. The only good news came from crude oil production, which fell 76,000 barrels a day, to 9.17 million bpd. Oil production is down over 400,000 bpd from the June 5th high of 9.61 mbpd.
In the end, oil bears got trampled over. Spot WTI rallied 8.4 percent for the week. Recall that the move preceded three back-to-back weekly dojis. Bears tried to push the crude below 43-44 for one whole month, but to no avail.
Now there is good support around the 47 area. The 50-day moving average (44.69) continues to curl up.
Near-term, the 200-DMA is right above (51.03), which was unsuccessfully tested on Friday. The session was not able to hang on to gains, in the end producing a shooting star. Daily momentum indicators are grossly overbought.
The path of least resistance near-term is probably down. Bulls need to step up to save support.
October 6 COT Report: Currently net long 285.8k, up 2.6k.
Gold: Minutes after the release of FOMC minutes on Thursday, Gold popped to 1,150.9, before reversing hard. The FOMC’s dovish message was no help. Correspondingly, the SPDR Gold ETF (GLD) jumped to 110.27, but the 11-month resistance proved too tough to conquer; in the end, the session produced a shooting star.
continue reading on the next page…
 Rolling Over At Key Fibonacci Level?")


 Rolling Over At Key Fibonacci Level?")
