The following is a recap of The COT Report (Commitment Of Traders) released by the CFTC (Commodity Futures Trading Commission) looking at futures positions of non-commercial holdings as of September 29, 2015. Note that the change is week-over-week.
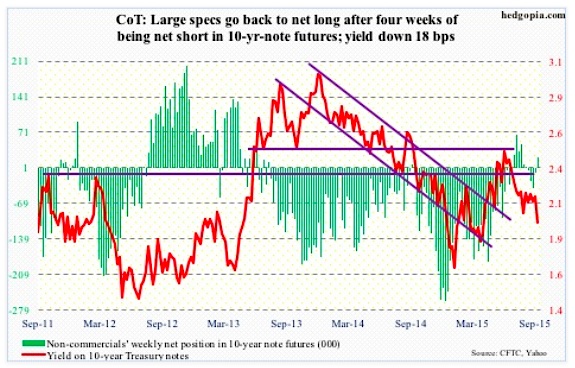
10-Year Treasury Note: Hat tip to bond vigilantes! Heading into the FOMC meeting two weeks ago, they never bought into the message coming out of the shorter end of the yield curve. Since then, the two-year yield has given back 24 basis points, even as the iShares 20+ Year Treasury Bond ETF (TLT) has rallied six-plus percent. The jobs report yesterday was as good a vindication as any they could possibly get.
It is not too often the 10-year Treasury bond yield sheds 13 basis points in a single session, which was the case at one point post-jobs report yesterday – an indication that even the vigilantes were not expecting the kind of payroll deterioration that September witnessed. There is serious deceleration in non-farm momentum, with four out of the last seven months sub-200,000 and the nine-month average this year of 198,000 well below the 2014 average of 260,000. The odds of a hike in October? Zero. Next in line of fire? Probably December.
In a little over two weeks since the FOMC meeting, the 10-year yield shrunk by 40 basis points. Too soon, too fast? Probably. Near-term, TLT looks like a short – was not able to keep all of its daily gains on Friday.
Non-commercials disagree. They went net long after remaining net short the prior four weeks.
September 29 COT Report: Currently net long 22.5k, up 31k.
30-Year Treasury Bond: Next week’s major economic releases are as follows, and it is relatively light.
Monday, we get the ISM non-manufacturing index for September. This Thursday, manufacturing PMI was disappointing – to say the least. The main index dropped from 51.1 in August to 50.2, reaching the lowest since 50 in May 2013. Similarly, new orders dropped from 51.7 to 50.1 – the lowest since 49.6 in May 2013. On the non-manufacturing side, however, things do not look as dire. The main index was 59 in August, and new orders 63.4.
Thursday, FOMC minutes for the September 16th-17th meeting come out. Post-meeting, this is what we learned. Four FOMC members do not expect economic conditions to warrant a liftoff until next year or later. One member predicts the fed funds rate will go negative this year and next.
Since that meeting, however, there has been a decidedly hawkish bent in speeches of several FOMC members. What changed? Not a whole lot on the data front. But stocks did sell off post-FOMC decision not to hike. So they are probably thinking financial markets are begging for them to move. We simply don’t know if that is the case. Not until they make a move. Once that happens – whenever that is – how markets react will have immense implications across asset classes as well as market volatility.
We also get international trade (Tuesday), consumer credit (Wednesday) and import and export prices (Friday).
Three FOMC members are on tap to speak, with John Williams, president of the San Francisco Federal Reserve, scheduled to speak twice. Also this week he delivered two speeches, and sees interest rates going up this year, perhaps as early as October. He said the decision to hold off on raising rates at last month’s meeting was “a very close call.” “I would view October to be a completely live meeting.” It will be interesting to see if he will voice the same opinion after this week’s ISM report as well as the jobs report. Probably not.
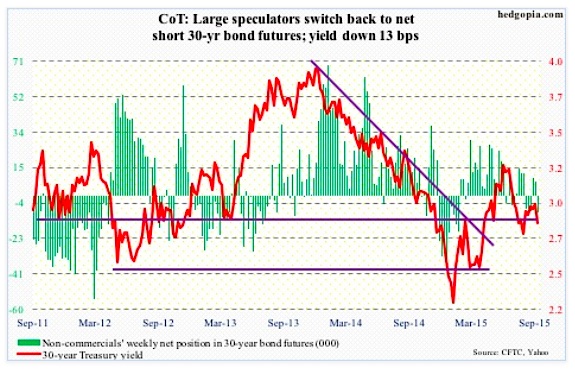
September 29 COT Report: Currently net short 9.1k, down 16.7k.
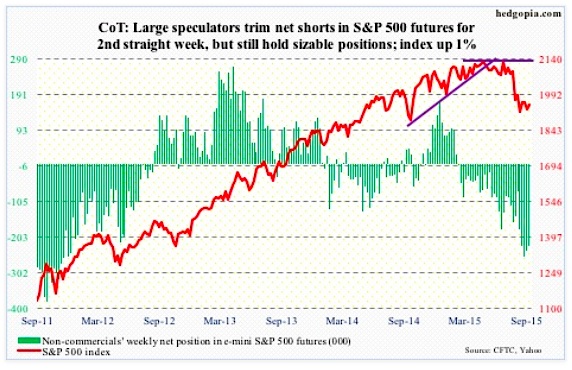
E-mini S&P 500: Investors Intelligence bulls’ count slid further this week, to 24.7 percent – the lowest since December 2008 (23.1). Stock market bears, too, jumped 4.9 points to 35.1, but their ranks can go a lot higher if the correction camp, stuck in the 40s for the last nine weeks, give up and turn negative. But would they? If they have hung in thus far, during which the S&P 500 index gave back 12.5 percent, odds favor the status quo continues. If anything, they might even begin to lean bullish on stocks – at least near-term. Earnings season and seasonality are two potential catalysts.
Speaking of seasonality, Goldman Sachs points out that based on averages for 2007 and 2009-1014 November is the busiest month of the year for buybacks among S&P 500 companies, and that the fourth quarter is the busiest quarter, accounting for 30 percent of buybacks. Let us hope the streak continues this year. Corporate buybacks have been a reliable source of buying power. Else, the dark clouds hovering overhead will begin to take over. For the first time in four years, September saw the S&P 500 close below its 20-month exponential moving average. This is a potential worry long-term.
Near-term, the path of least resistance is up – also suggested by the Hedgopia Risk Reward Index. The Friday reversal needs the benefit of the doubt, especially having come amidst the prevailing gloomy sentiment.
September 29 COT Report: Currently net short 283.2k, down 12.6k.
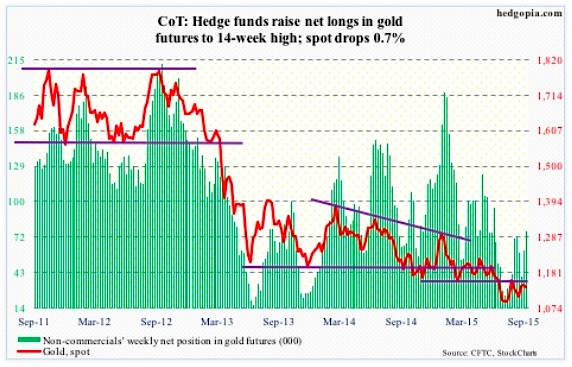
Gold: The precious metal had a lackluster week – until Friday, that is. In the first four sessions, gold was down 2.9 percent. Then came the jobs report. gold got bid up – hard – rallying 2.2 percent and retaking the 50-day moving average. With this, gold is once again banging at the 1,140 resistance, which goes back 11 months. That average is beginning to curl up, by the way. There is room for gold to move higher on a weekly chart. A break of that resistance will be a major victory for gold bugs.
Non-commercials have been actively adding to net longs – up 94 percent in two weeks.
September 29 COT Report: Currently net long 76.6k, up 15.5k.
Crude Oil: The week produced a mismatch of good and bad.
Crude oil inventory was up four million barrels in the week ended September 25, to 457.9 million barrels (up 101.3 million barrels year-over-year, by the way!). Gasoline stocks rose 3.3 million barrels, to 222 million barrels (up nine-plus million barrels in the past six weeks).
continue reading on the next page…
")


