Carl Icahn isn’t the only billionaire who has functionally monetized social media in the service of his book.
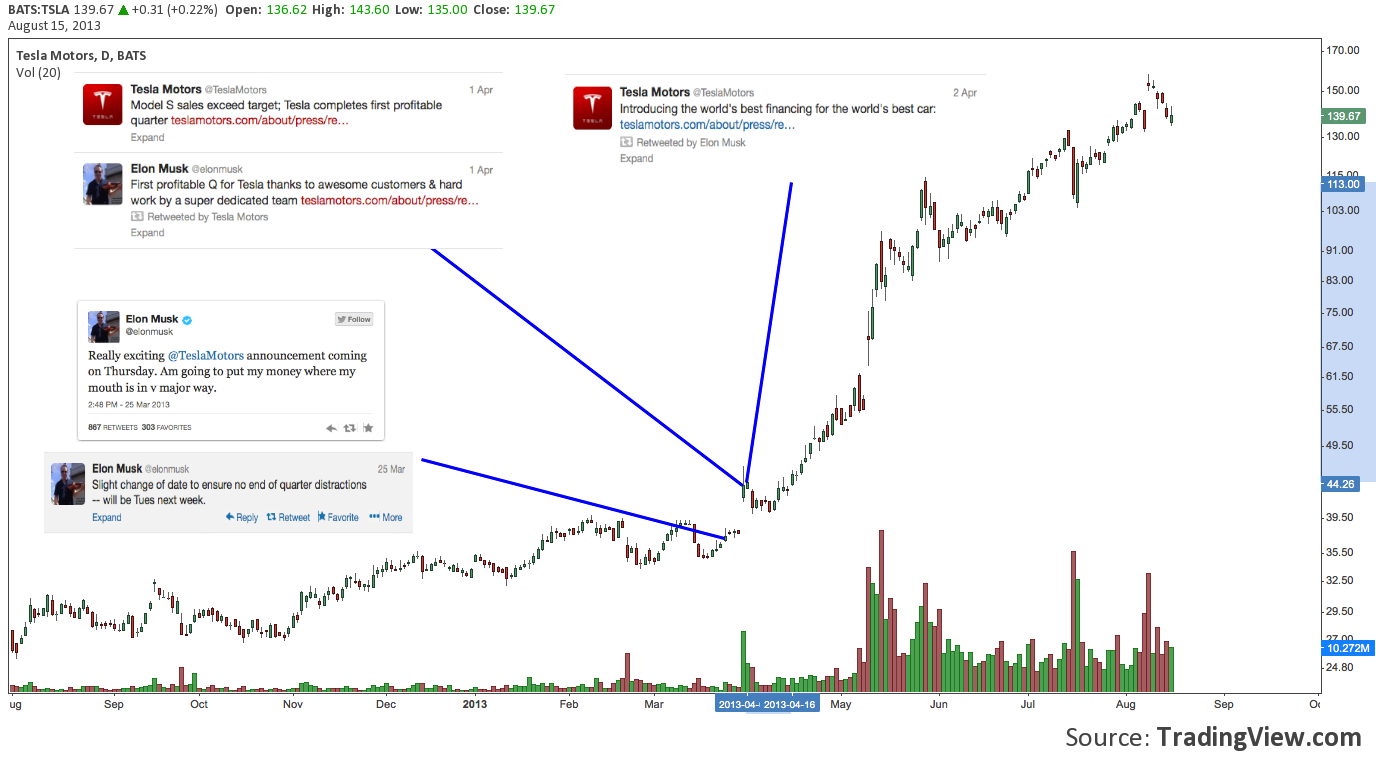
The inception of electric car and powertrain component manufacturer Tesla’s multi-month parabolic stock price run-up and its vault to the exalted status of Wall St. darling were similarly catalyzed by a couple of deftly-staged tweets.
On March 25, Tesla (symbol: TSLA) CEO Elon Musk tweeted three times: the first about North Korea being one order of magnitude crazier than “batsh*t crazy”, while the other two were cryptic allusions “exciting” announcement regarding Tesla. Though Elon pushed the announcement back until April 2 in his final missive of the day, the anticipation generated by his first tweet was enough to net TSLA nearly +4.25%by the close of trade.
Then while observers were watching and investors modestly accumulating, on the following Monday, April 1, Musk took to Twitter again, divulging the excellent news about Tesla’s Model S surpassing its February sales target and the company’s enjoyment of its first profitable quarter after 10 years in business. “Excellent” may be understating the case: the announcement propelled TSLA almost +16% higher. The originally anticipated announcement about Series S financing came the following day, adding an additional 1.7%.
Tesla (TSLA) – Daily: Mapping Tesla Motors and CEO Elon Musk’s Tactical Engagement of Social Media
Mega-Influencers and Social Media M.O.s
There’s a highly important distinction to be made between the social media modus operandi of Icahn and that of Musk. Some may besmirch Icahn, while others will find no fault (check out Stocktwits CEO Howard Lindzon’s balanced analysis yesterday); but it’s clear these two figures represents much different approaches to the highly potent and global reach their tweets have. Juxtaposing their approach, the best I can offer to explain is Musk employs Twitter organically; while Icahn – at least so far – appropriated Twitter for his use. The debate over how social media is variously used by CEOs and major money managers this evokes will be an important one in the weeks and months ahead.
In the case of Musk and Tesla, the news broken on April 1 and April 2 is of less interest than the foreshadowing of positive news made on March 25th. His tweets on that day weren’t the sufficient and total cause of TSLA‘s performance then – nor are they responsible for the decisive breakout on April 1st: but their role as issuer of an oblique invitation to “buy ahead” by drumming up positive anticipation is highly noteworthy. And if Carl Icahn’s utilization of Twitter is any indication, terse market-moving missives from major influencers is a trend that is just beginning.
Tesla Breaks Out
Whatever their net impact, Musk’s tweets came at a decisive moment: for Tesla’s brand recognition, for the nascent cult of personality growing up around its charismatic CEO; and for the company’s stock, which broke above $40 on April 1 and went on to nearly quadruple in 4 months. With reference to the chart above, TSLA installed an impressive up-trend from $40-$55 after its big day on April 1, and then screamed higher in an all-but vertical trajectory from $55 to almost cap out at $97.12 only 6 weeks later. Since mid-May when price retraced from $97 to $85, the lift-off has moderated but still managed to nearly double the stock from that point, installing an all-time high August 8 at $158.88. We’ll have occasion to look at these levels in more detail in just a moment.
The resulting chart of TSLA is simple to comprehend – but going beyond the obvious comments about a “parabolic” move is more difficult.
Tesla (TSLA): Weekly Chart – Hyper Fibonacci
To put TSLA‘s staggering 4-month long run into a comprehensible context, let’s look left, considering the last 2.5 years.
Beginning in late 2010, Tesla’s stock embarked on the first of two lengthy congestion phases between $25-$40. “Congestion” is a matter of perspective: the $15 range covered is remarkable but relatively insignificant now; whereas then that range represented a 70% swing – a solid momentum-driven stock that was a modest foretaste of its future self.. In March 2012, a similar range got under way that lasted another year.
Altogether, the long high-low-high swing of these two periods formed saucer patterns inside what is effectively an ascending triangle.
The imposition of the saucer interpretation may seem unnecessary, but it is included here because the fibonacci extensions that came off of these swings have played a defining role in TSLA‘s technicals ever since.
Both saucers produce tightly-clustered extensions:
- The first is the 423.6% extension which a) was the points where TSLA exited its vertical ascent and entered a moderated rising channel, and b) provided support near 85, acting as the floor for TSLA‘s first correction of any note since September-October 2012.
- The second is the 847.2% extension. If you haven’t seen this ratio before, it’s because instruments and asset classes rarely occasion its use – except to measure massive up moves such as TSLA‘s (note: this ratio is 2x the 423.6%). Here the 847.2% extension falls at $148-$149. With the exception of a special situation we’ll check out in just a moment, this ratio marks TSLA‘s all-time high to-date.
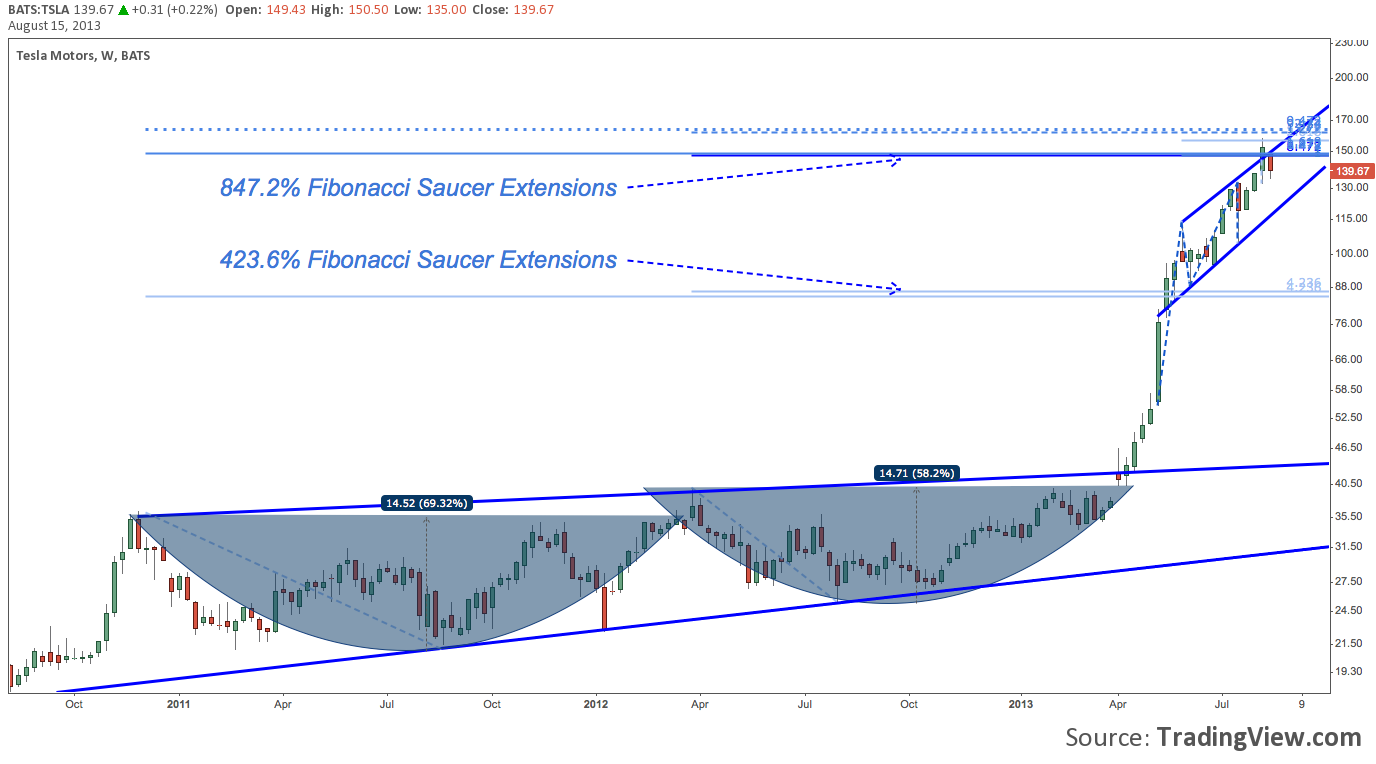
There’s more going on between $148-$160. The 947.2% extension (the next major fibonacci ratio up) falls at $161-$162. There’s shorter-term measured move resistance given off by the May-August rising channel near $155. Plotting the 585 and 685% extensions (omitted here for clarity) provides a virtual horizontal support-and-resistance roadmaps for the intra-channel swings in May-July. All-told, each of these features adds up to cluster resistance between $148-$160.
Tesla (TSLA) – Daily Chart: Rising Channel, Slackening Momentum
With that background, let’s take a more granular look TSLA‘s rising channel. Getting underway in May after the post-Q1 earnings spike to $97.12 and subsequent correction to $85, Tesla’s 3-month long channel has been characterized by plodding climbs to resistance, then punctuated by short, dramatic moves down. This is observable at the end of May, through mid-July and then through mid-August.
Each of these corrections (actual bear markets on 2-of-3) has measured roughly 20% peak-to-trough. On the last climb, TSLA seemed to break the cycle, gapping above channel resistance on August 8th to as high as $158.88 and then remaining there the next session to finish out the week. This past Monday, August 12 however, TSLA gapped down to open at the channel’s resistance-now-supporting trend line. A hopeful hammer was printed that day, but Tuesday and Wednesday brought the stock firmly back into the channel. The result is an island reversal with the gaps bookending 08/08-08/09 and a confirmed breakout failure.
Over the course of the channel, TSLA has found support between its 13-Day and 21-Day EMAs (more fibonacci, for consistency), including today’s modest bounce as the S&P 500 (symbol: ES) lost -26 points; and this after losing -4.1% yesterday while the S&P lost less than -0.5% (click image to zoom):
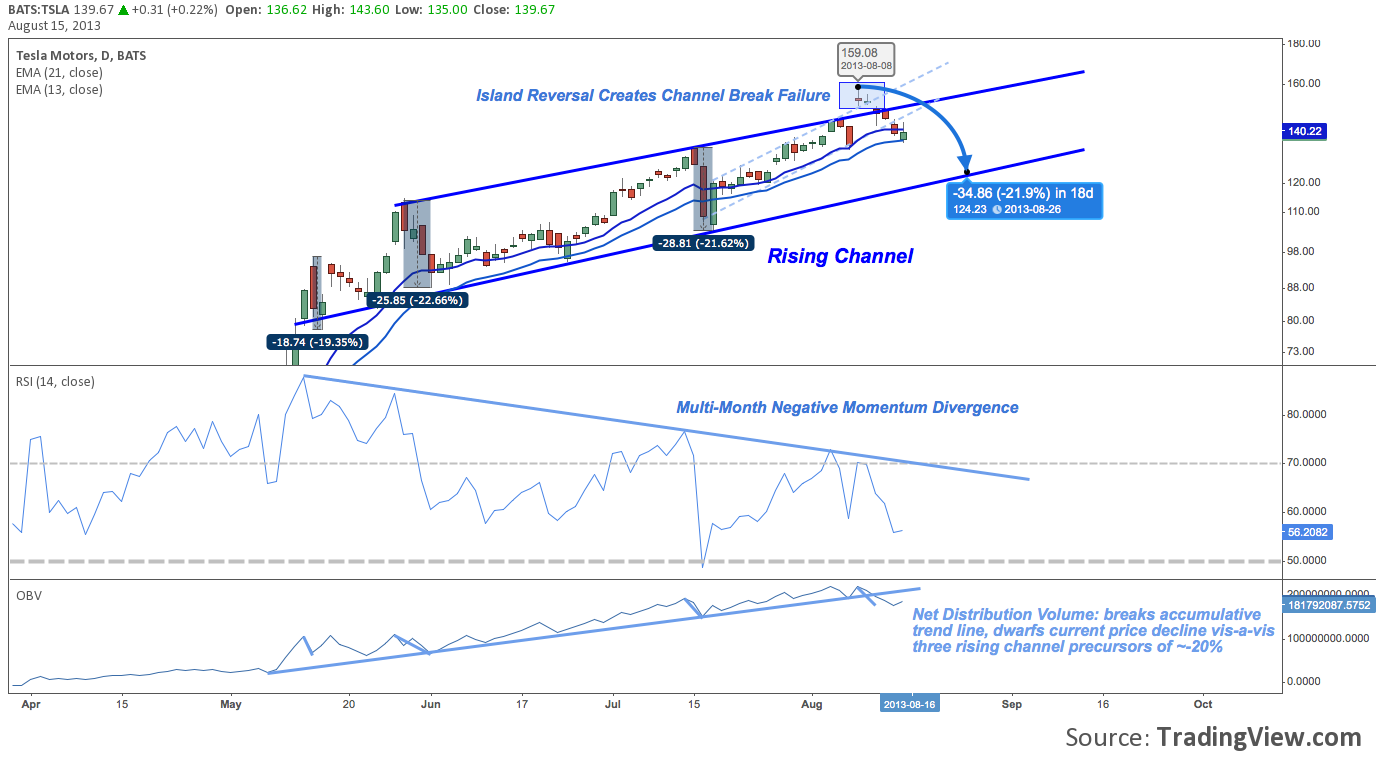
There are reasons to suppose TSLA may be headed for a deeper correction, however.
- The Island Reversal/failed channel break looms heavily: this is a major short-term test and failure of TSLA‘s ability to re-galvanize (zing) the momentum that carried it from $50-$100. An substantive move lower from here cleans out the glut of weak hands this technical event is usually symptomatic of.
- Momentum is fading. That shouldn’t be news, given the “crazy as North Korea” (thanks, Elon) level of buying pressure TSLA took with it through Q1 earnings into mid-May. But note: after its mid-May correction of nearly 20%, TSLA made a new high at $115 on May 29 on lower momentum. Then on July 15 a then-all-time high at 133.26 and a lower momentum peak. The same scenario – ATH, lower momentum – occurred again on August 5th at $145; and August 8th at $158.88. In the last case, RSI nudge over 70 by a rounding error. The result is a multi-month negative momentum divergence: that is not a sufficient reason to sell or short on its own; but an abiding negative factor not to be ignored.
- Similarly, buying pressure isn’t what it once was. On Balance Volume (OBV) has dropped below the rising trend line it has maintained through the entire May-August price channel. By itself this isn’t decisive, but it does signal that TSLA has hit a short-term accumulative saturation point from which a comparatively small price decline can generate appreciable negative volume. The drop is comparable to those installed in late May and Mid-July, during which price declined over 20%. These relationships aren’t 1:1; but a comparable move would take TSLA to roughly $124, through its supporting EMAs and more than -10% off its today’s close at $139.67 to rising channel trend line support.
What if TSLA broke below $124? The next major support rung is May 29th’s $115 high; followed next by July 16-17th’s low at channel support around $105.
Could this happen? Though it almost requires a willful suspension of disbelief to say it, the answer is: of course. These signs aren’t decisive, but they are more troublesome signs than TSLA has exhibited since beginning its channel near $100 in May. The technical picture is more mixed, and now is an important time to sit up and take notice, whether your objective is to safeguard unrealized gains, or get the jump on viable short setups that may emerge if these technical misgivings begin to cut deeper into the durability of TSLA‘s rally.
Twitter: @andrewunknown and @seeitmarket
No position in any of the mentioned securities at the time of publication.
Any opinions expressed herein are solely those of the author, and do not in any way represent the views or opinions of any other person or entity.

 Ready To Break Out?")


