The tech sector has been the space to be in the last three months. Anyone involved in financial markets is well aware of that. But the recent strength in Apple, Inc. (NASDAQ:AAPL) has been adding some fuel to the tech rally and its outperformance of the broad stock market indexes. The tech sector in its entirety has been performing well, with semis, some old-tech dividend stocks and, of course, Facebook (FB) and Amazon (AMZN), all having an impressive year.
For Apple, however, following a weak start to the year, it began a strong run at the end of June and closed up ones of its best weeks ever last Friday with an 11.4% surge. The new iphone 7 release coupled with the “explosive” issues tied to Samsung’s Galaxy Note 7 device certainly played a role in its recent run as well. Apple has now begun to outperform the tech sector (as a whole), as we’ll see in some charts below.
But let’s get back to the tech sector for a moment before moving on to Apple. The Technology Select SPDR ETF (NYSEARCA:XLK) is up 26% from its February lows and +14.75% from the end of June compared to about half that (+7.3%) from the S&P 500 in the same three month time period.
Before the recent pick up in volatility, the broader stock market market went through a Summer doldrums lull. The S&P 500 traded in a very tight 1.6% range from mid-July into the end of August as it digested a 10% run from the June 27th lows. The XLK, meanwhile, came out of the same six week consolidation period with a spike to 2016 highs before dipping back down. That dip saw a brief stint below the 200 day moving average before rallying back up to just below the yearly highs on September 15th. The Tech sector has, therefore, accelerated its outperformance in the last week.
Let’s take a quick look at some charts for some perspective
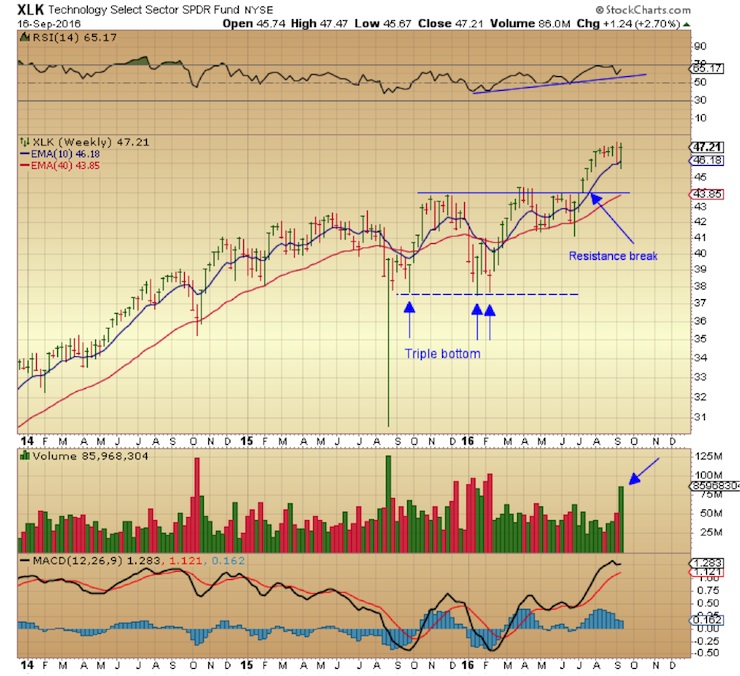
As shown in the weekly chart above, the Technology Sector ETF (XLK) is coming off a somewhat sloppy triple bottom. Personally, Id like to see the three lows spaced a little wider. However, the price action speaks for itself in this case. The resistance break on the weekly chart took place on the week of July 11th and price has risen another 7.5% since then. Volatility picked up the last two weeks but the ETF is still above the rising 10 week moving average. While it is getting a little extended here, it is not yet overbought. The RSI is bullish and rising while the MACD is flattening but also in positive territory.
The XLK closed out the week up 2.7% after successfully retesting the 10 wma for the second time in two weeks and it did so on huge volume (highest since February).
Let’s also take a quick look at the XLK relative to the S&P 500 (SPX).
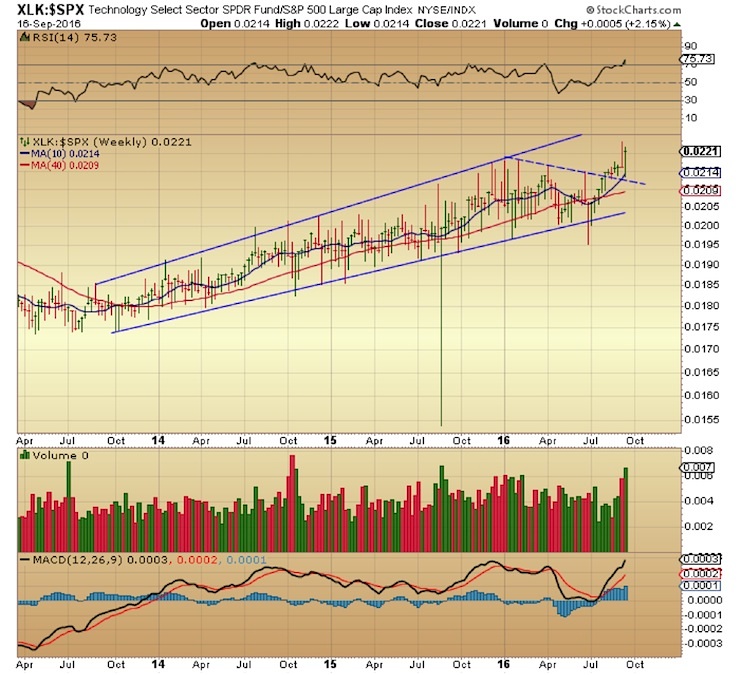
The weekly chart of the XLK relative to the SPX shows a broadening formation with gradual outperformance by tech over the broader S&P 500 index starting in 2013. As well, we can see more marked strength from the Technology ETF off the June lows of this year when it broke its post-2016 downtrend line on big volume. It’s worth noting that the XLK represents roughly 21% of the S&P 500.
As for Apple’s role here, when the largest US company by market cap goes on a 26% run in twelve weeks, it undoubtedly lifts the entire sector. Especially when considering the plethora of stocks tied to Apple’s supply chain. That’s not to say that Apple (AAPL) is entirely responsible for the XLK’s strength. As mentioned earlier, some prominent names in the tech space have also played a key role. Nevertheless, Apple’s size and weight bolstered the sector’s performance and helped it emerge as an undisputed leader year to date, while providing some added strength for the market overall.

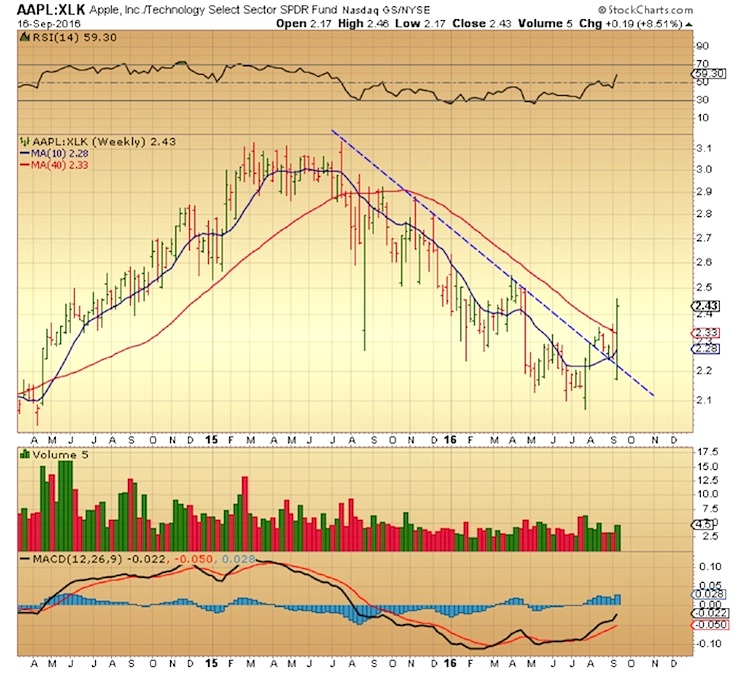
In the weekly chart of Apple (AAPL) relative to the XLK (charted above) you will see that AAPL reversed a 12 month underperformance to the tech ETF in July. At that time, it broke out above the post-July 2015 down trendline. Last week’s range was huge and ended with a large bullish engulfing bar that confirms the tremendous strength we’ve seen in the stock. It’s worth mentioning that Apple represents roughly 13% of the XLK’s portfolio.
As usual, when tech is strong bubble talk ramps up and the inevitable comparisons to the dot.com bubble crash in 2001 emerge. While valuations are getting a bit lofty, it’s difficult to sustain that they are broadly overvalued or anywhere near the levels of the dot.com bubble era.
Having said that, a rest here would certainly be healthy for a continuation higher into year end. But the bottom line is that there is no visible sign of a major breakdown in the tech sector on the horizon. Some might even sustain that tech’s rally is just getting started. That remains to be seen. How the tech sector holds up to an eventual increase in market volatility is also unknown. But we’ll deal with that if (and when) we get there. For now, it’s still the place to be in my humble opinion.
Thanks for reading.
Twitter: @DDCapitalFund
The author does not have a position in mentioned securities at the time of publication. Any opinions expressed herein are solely those of the author, and do not in any way represent the views or opinions of any other person or entity.

 Rolling Over At Key Fibonacci Level?")


 Rolling Over At Key Fibonacci Level?")

