 With a single exception, the major money center banks and bank holding companies we checked in on at the market’s February bottom (here) are in predictably better shape today.
That said, their collective technical state remains on precarious footing.
While Financials in general and Banking stocks in particular may simply be “marking time” before continuing higher, the persistence of the congestion zone characterizing the last few months continues to suggest it’s wise to exercise caution on the long side and remain abreast of potential short opportunities.
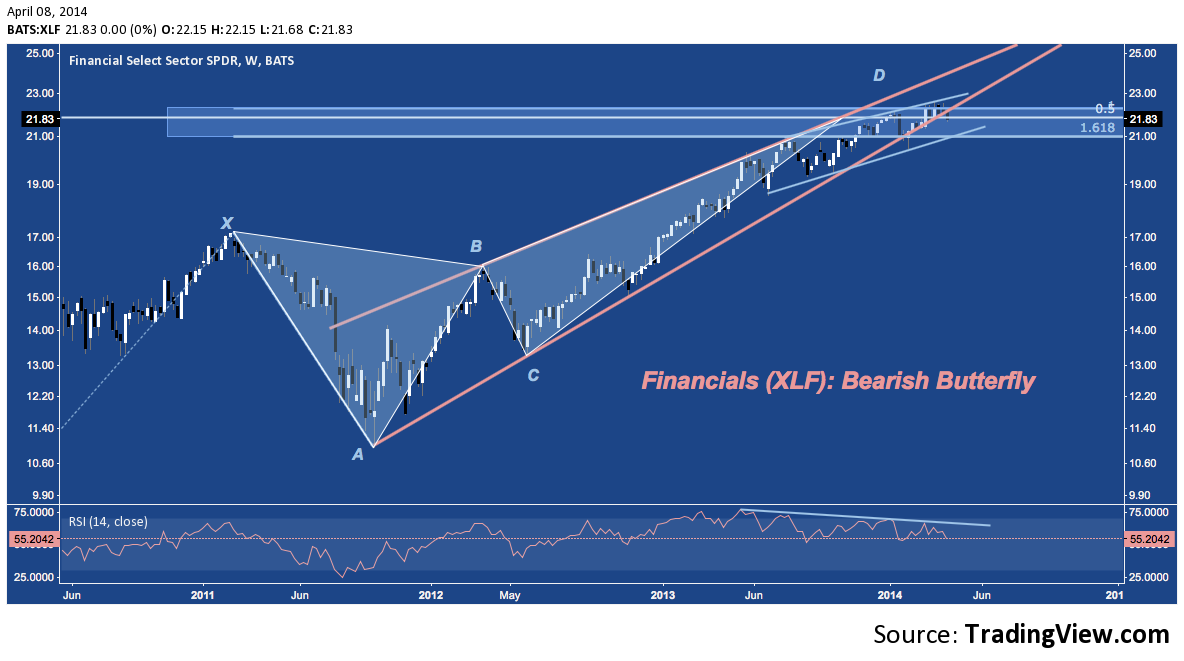
Starting with the overarching Financials Sector, XLF is representative of the pause in trend TBTF banks have been winding through since late last year. Overall, the sector remains at it’s 3-year Bearish Butterfly Potential Reversal Zone (PRZ), while struggling to holding wedge support (orange) off its Q3 2011 bottom (at ‘A’) and finding rejection at the last year’s rising channel (blue) near $22. The negative momentum divergence visible on RSI is a function of the moderation in trend begun in the middle of 2013. Whether this means price will roll over is yet to be answered; but the technical context remains a challenging one.
Zooming in to the KBW Bank Index (KBX) – the 24-component industry benchmark of money center and large regional banks – we see a nearly identical chart, right down to the Butterfly PRZ and flagging momentum.
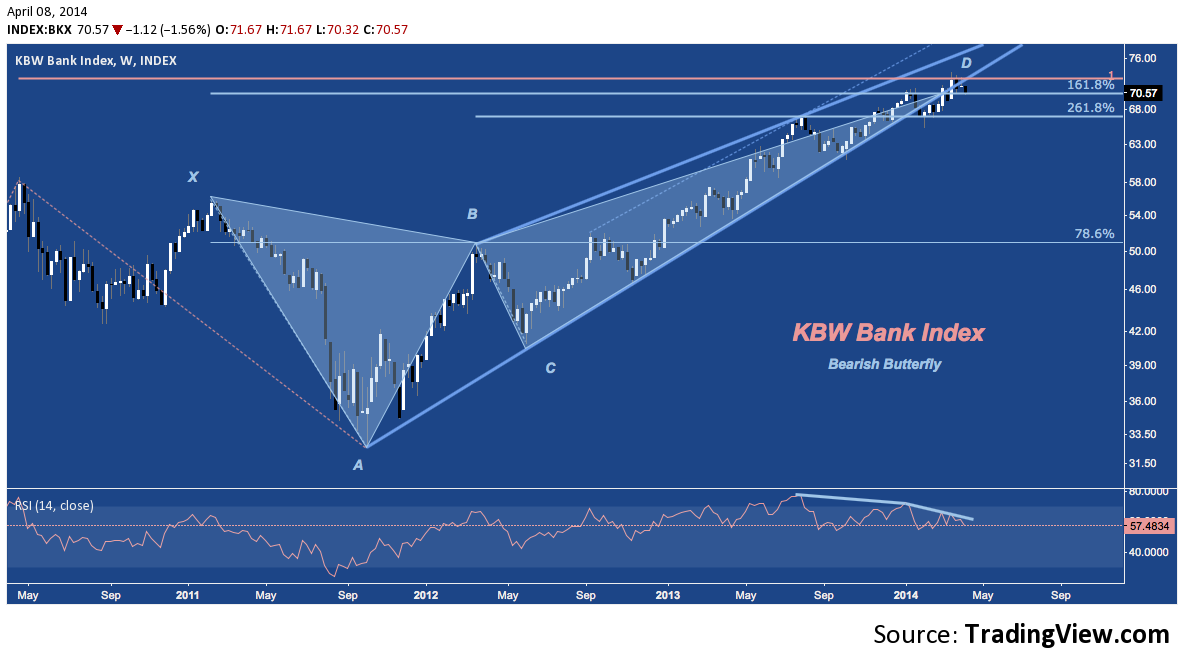
Along with Suntrust (STI), JP Morgan (JPM), Wells Fargo (WFC), Bank of America (BAC) and Citigroup (C) comprise over 1/3 of BKX.
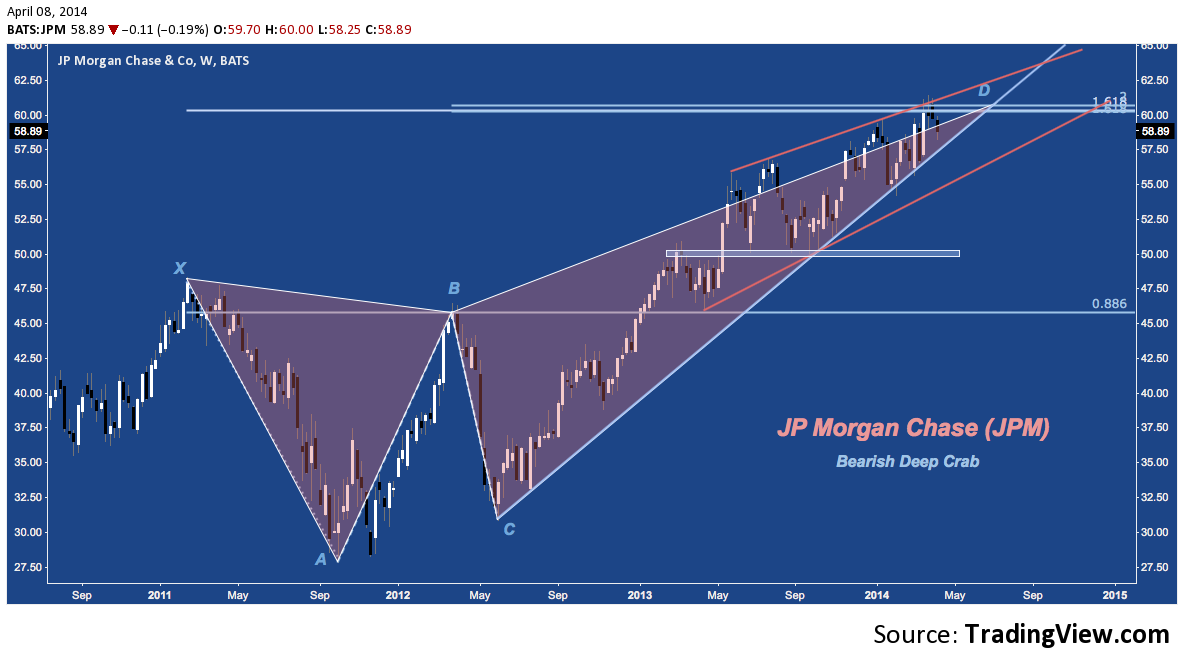
JPM has fared well among its peers since our February review, rally to stage it’s first true test of Bearish Deep Crab resistance just above $60 in mid-March. Coinciding with 1-year rising channel resistance (much like XLF), JPM failed around $60-$61 and is again nearing rising trend line support beginning from the May 2012 bottom (at ‘C’). Together channel resistance and this supporting TL create a terminal rising wedge. Any bounce from here back toward $60 will force a culminating decision. Whether that outcome occurs or not, the first support rung following a downside resolution is at the bottom of the channel near $56. Below there, the next major support comes in at $50.
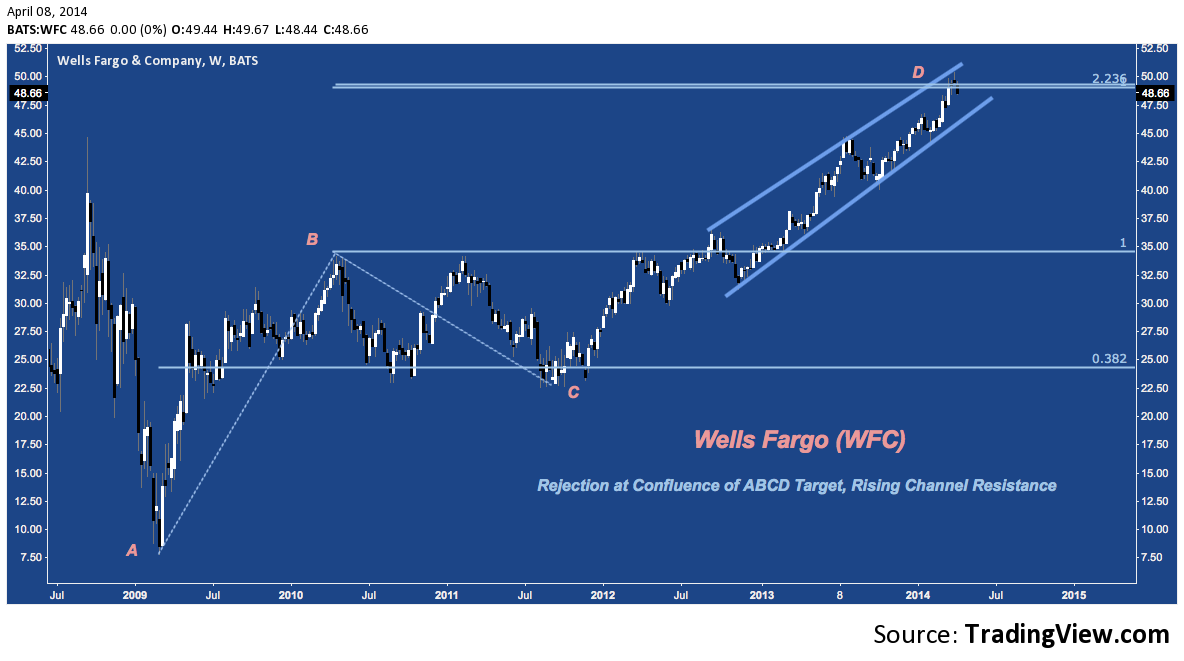
Wells Fargo (WFC) has had the most constructive price action of the banks discussed here, pushing well above the late 2008 failure spike high near $45. Now WFC is up against a confluence of resistance near $50. created by it’s 15-month rising channel, and cluster resistance at the culmination of it’s 5-year ABCD pattern. Channel Support is near $47, with the next potential run at $44.50-$45, and then $40.
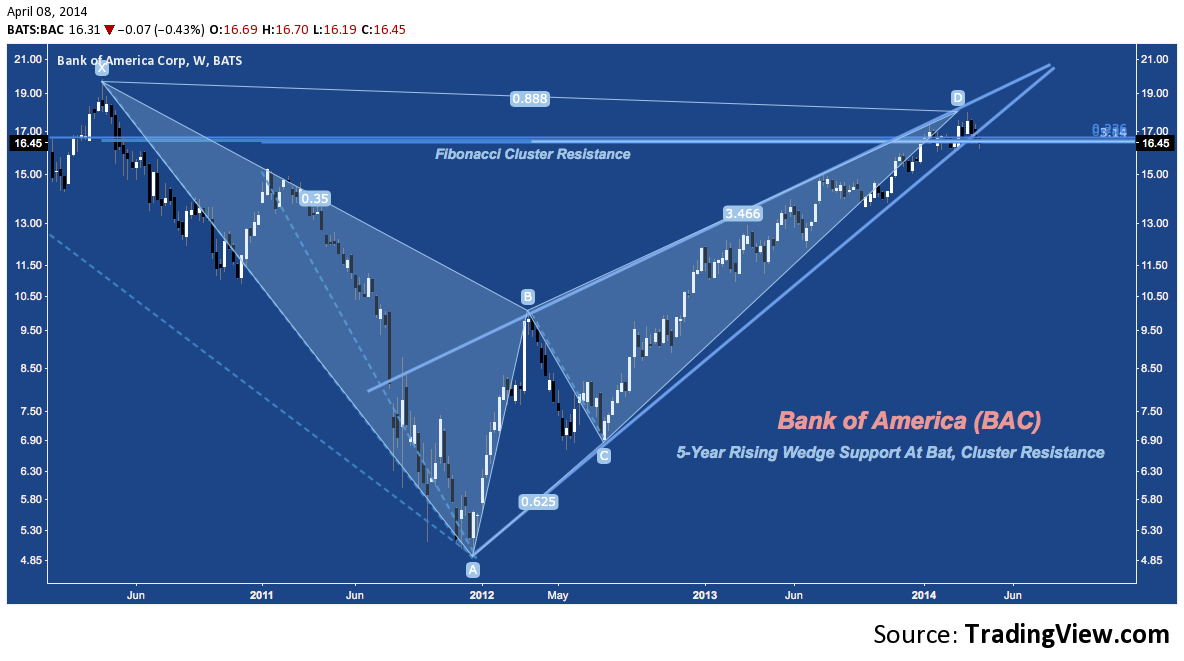
Bank of America (BAC) has actually broken 2.5 year Rising Wedge Support, faltering its Bearish Bat PRZ near $17. 2013’s stair-step advance leaves many potential horizontal support levels below, with $14.00-14.50 and $11.50-$12 being the most notable ahead of $10 near ‘B”.
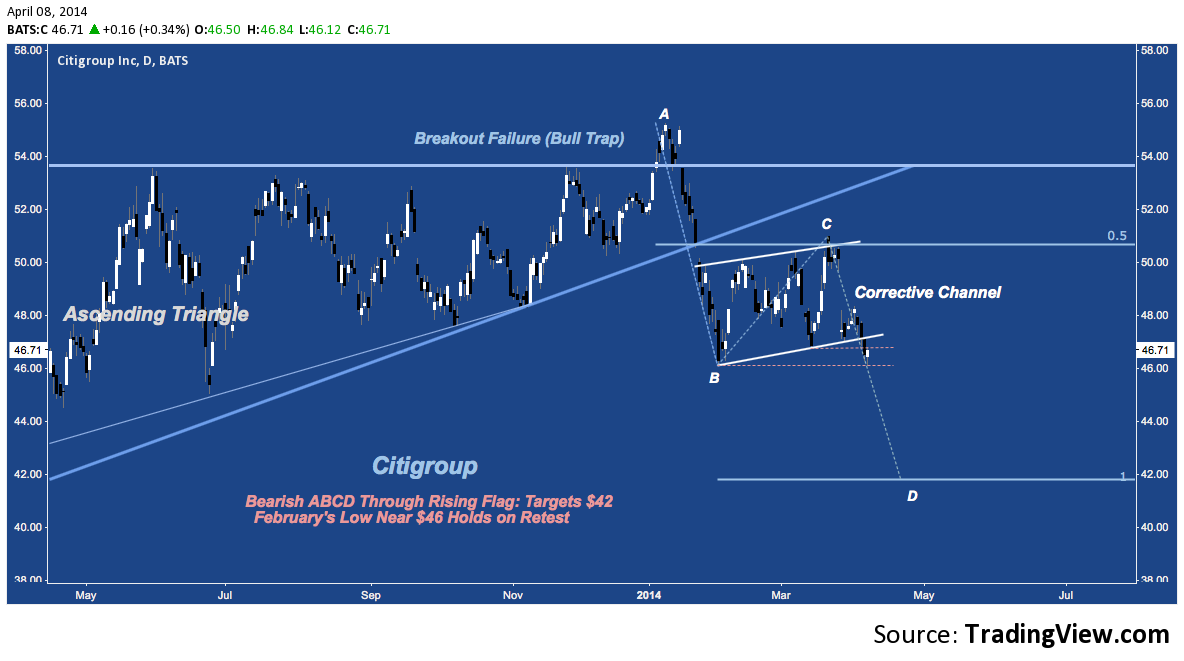
Citigroup’s (C) chart stands in glaring contrast to it’s peers: the stock simply hasn’t been able to hold a bid all year beginning with the multi-week double digit decline studied in greater detail here. Citi’s half-hearted attempt to recover the rising trend trajectory (denoted by the heavy diagonal blue line) failed at ‘C’ in mid-March, kicking off the final leg of a Bearish ABCD that ultimately target’s $42. This week is proving very important medium-term: yesterday’s sell-off snapped the stock’s corrective channel, while 02/03/14’s $46.19 low (at ‘B’) spurred a horizontal support bid this morning.
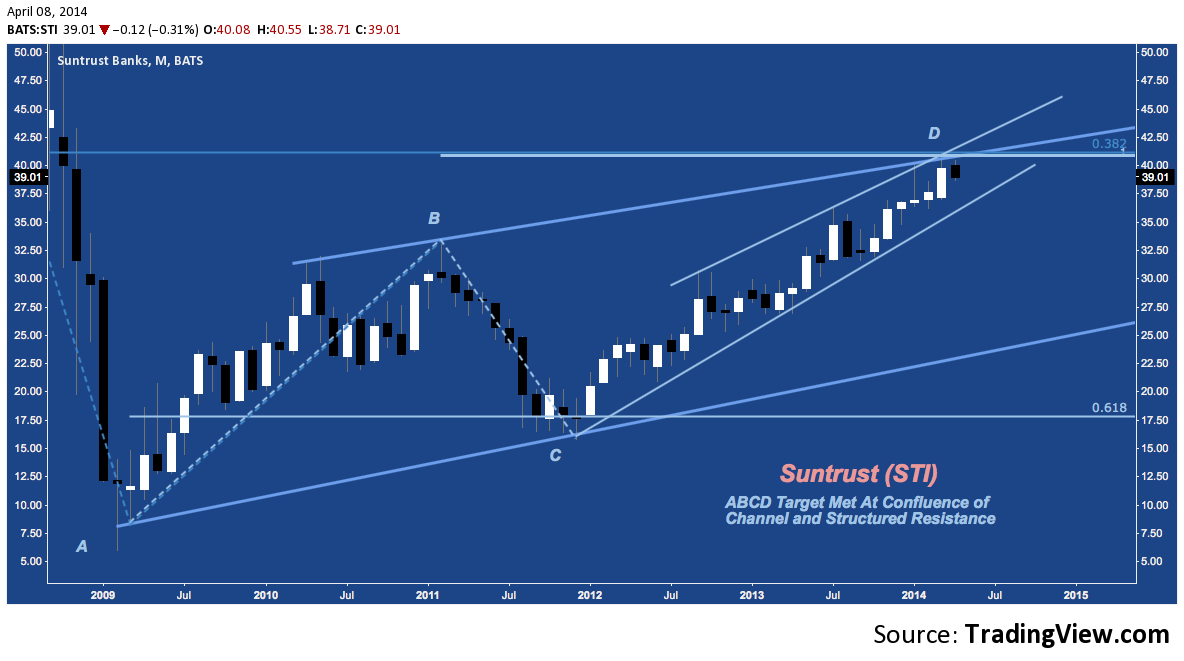
As a large Regional, Suntrust (STI) has followed a different technical path to this point; but is also beset by long (5-year) and medium (2-year) rising channel resistance ABCD and Cluster Resistance Near $40. Support here comes in at ‘CD’ Channel support near $37.50, followed by horizontal support giving off by ‘B’ near $32. Long-term channel support comes in near $27-$28.
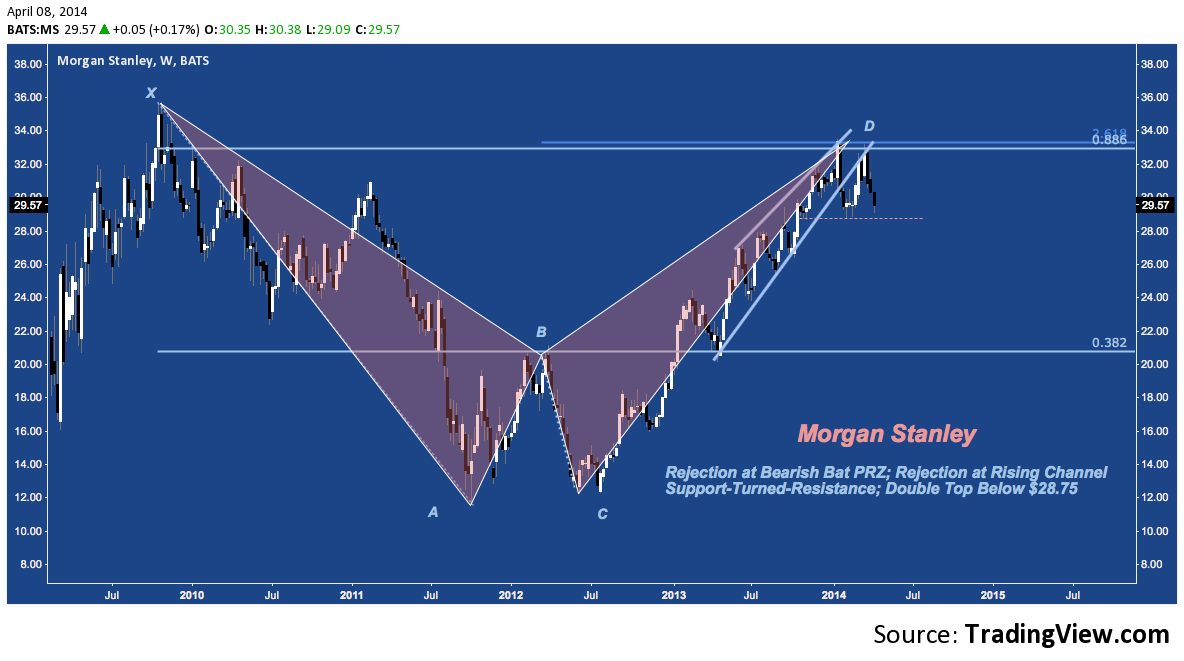
Turning to other Bank Holding Companies, Morgan Stanley (MS) looks just like BAC would after a bit of real trend deterioration. Like Bank of America, MS exhibits a Bearish Bat; but here the stock has broken down from the PRZ, falling out of its 1-year rising channel and now threatening a doubple top below $28.75 that would target ~$24-25. The next major support rung following that target comes in at ‘B’ near $20.50.
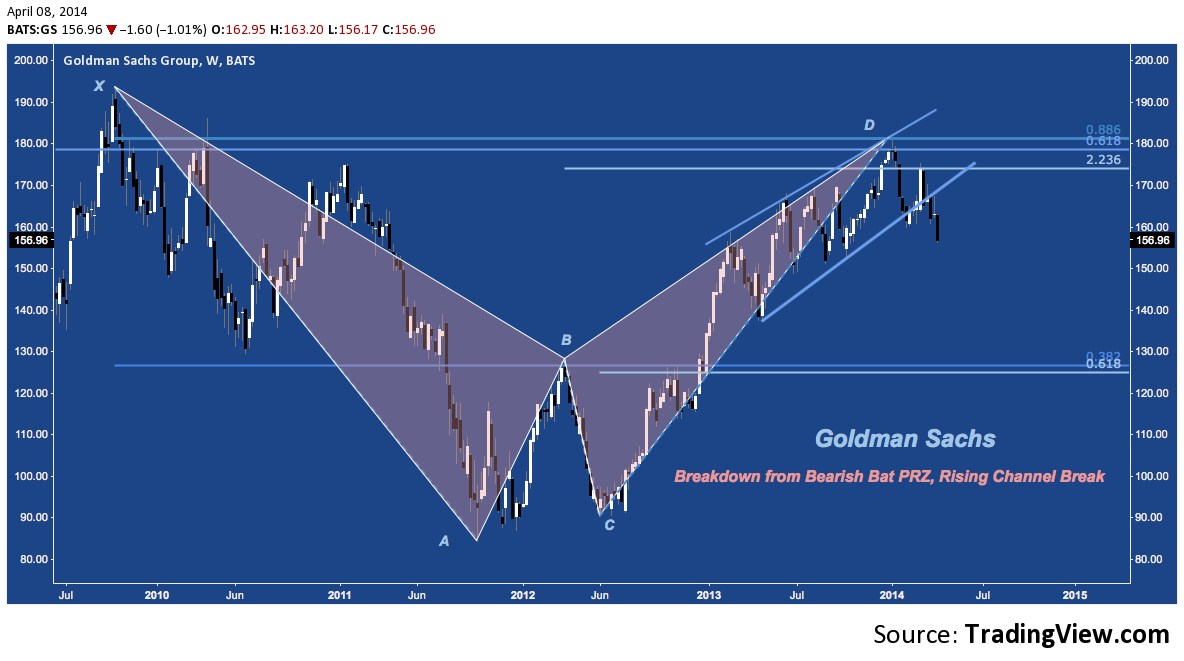
Last up, Goldman Sachs (GS) – which usually looks just like MS – is breaking down from its Bearish Bat PRZ and below the last year’s rising channel. While they’re technical doppelgangers, GS almost always fares better than MS; but here that isn’t the case. This is the “exception” we referred to in the opening paragraph as the sole laggard in worse shape than it was in February. The week isn’t over by any measure, but after a protracted battle with the supporting trend line, the candle currently underway is the first to really break down from 2013’s rising channel. There’s a possible multi-month H&S top in the second half of the channel (though with a steep diagonal neckline which renders it technically ambiguous), as well. Retain this pattern or omit it, though: GS is breaking down heavily. Support comes in at $150; followed by the major rung around ‘B’ between $125-$130.
Author carries no position in any security mentioned at time of publication. Commentary provided is for educational purposes only and in no way constitutes trading or investment advice.
Charts courtesy of tradingview.com.
Any opinions expressed herein are solely those of the author, and do not in any way represent the views or opinions of any other person or entity.


 Ready To Break Out?")


 Ready To Break Out?")
