Tag: intermarket analysis
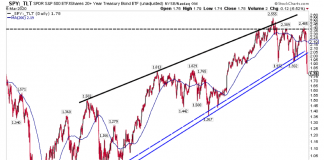
Intermarket Analysis: U.S. Equities Correction Getting Nasty
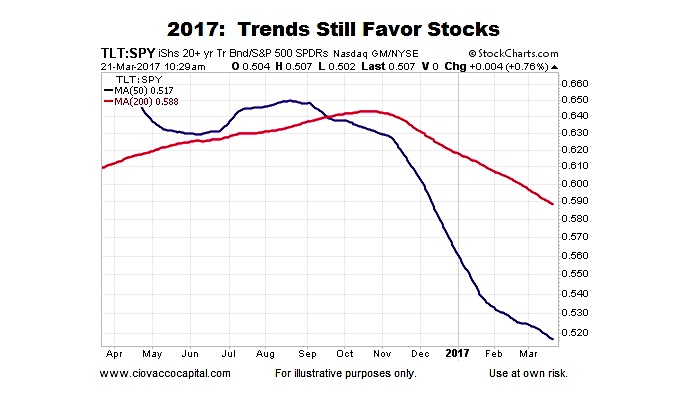
Intermarket analysis is simple.
We measure two assets against each other. We want to see the riskier asset trending higher in bull markets.
When we look through...
Why I Fear The “Ides of March” for the Stock Market
The following article is a part of my Gone Fishing Newsletter that I provide to fishing club members each week to identify macro inflection points and...
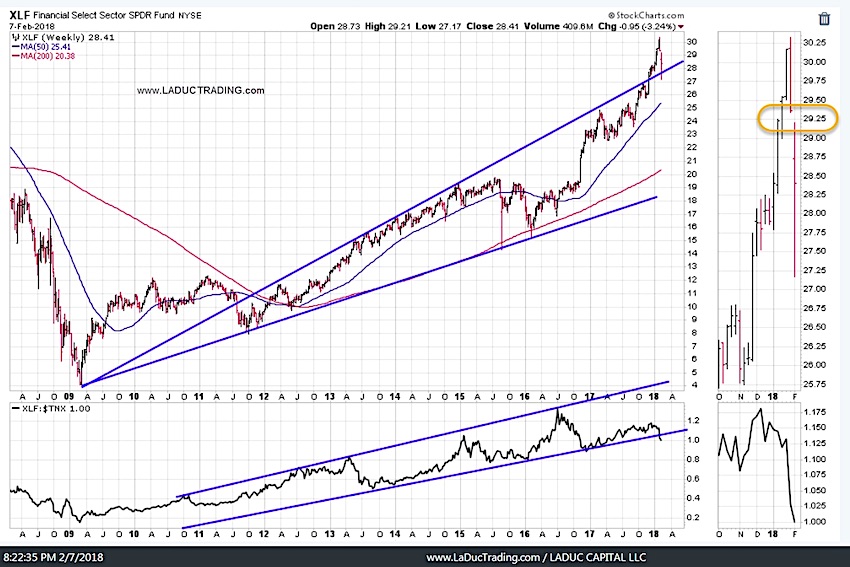
6 Inter-Market Charts Highlighting Current Stock Market Dynamics
Inter-market analysis is useful for determining underlying market conditions for active investors.
Several inter-market tools are underutilized because the takeaways aren’t exactly clear and ratios...
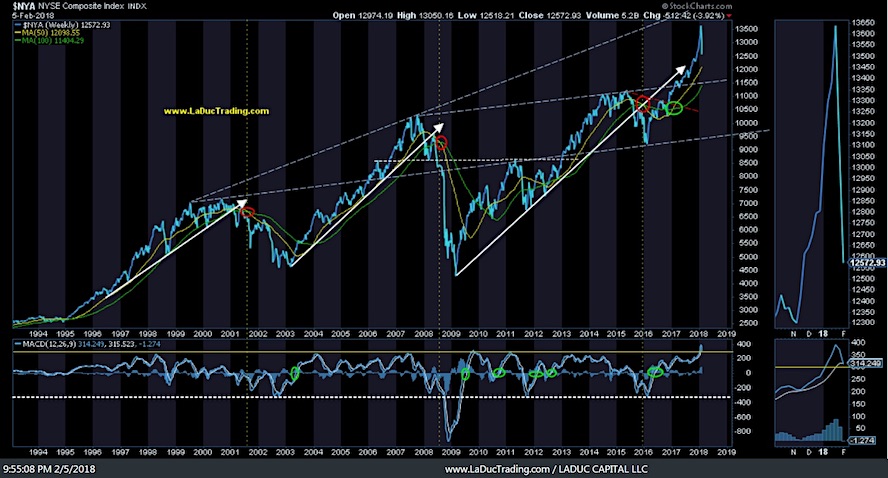
Intermarket Chart Attack: Not Done (Part 2)
This is an Intermarket Analysis chart review that I provided to my fishing club members Wednesday to prepare for the stock market downdraft I expect to continue.
These...
Intermarket Chart Attack: Not Done
This is an Intermarket Analysis chart review that I provided to my fishing club members this past weekend which graphically represents relationships (strong and weak) that can...
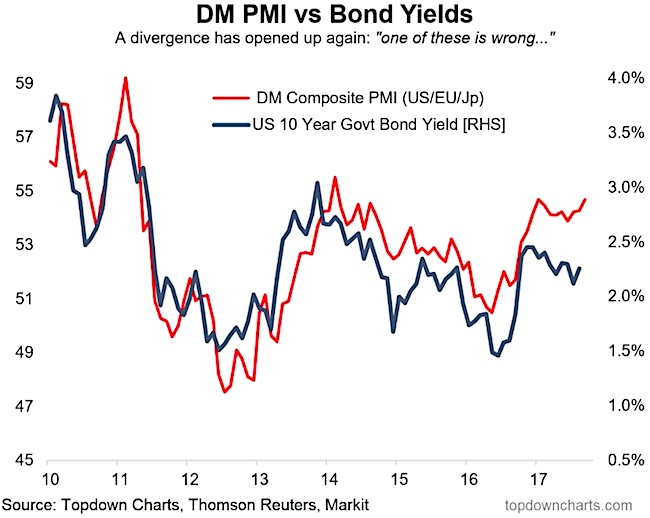
Is The Bond Market Wrong About The Global Economy?
The September round of flash manufacturing PMIs saw our composite "global flash PMI" rising +0.4pts to 54.7 - the same level it got to...
Are Bonds Flashing A Warning Sign For Stocks?
What Does Fear Look Like?
Typically, when markets move into a long-term risk-off phase, the conviction to own defensive-oriented bonds begins to increase relative to...
Corporate Credit Markets: Party Like It’s 2017!
It has been quite a while since I have written about the state of the corporate bond market.
Longtime readers know that I follow the...
Is Inflation Peaking Or Ready To Blast Off?
As investors tune in for the Federal Reserve today, they will be listening/watching for clues as to their next move and thoughts on the economy....
This Fundamental Driver Could Propel Stock Market Higher
The U.S. Dollar Has A Possible Air Pocket Below Support
The chart below shows the U.S. Dollar ETF (NYSEARCA:UUP) dating back to late 2013. Notice...

