Yesterday, I noted that the Dow Jones Industrial Average (DJIA) has been bumping up against a key technical resistance level all year – its 1.618 Fibonacci extension level (around 18,200). But this may be a more important price point for stocks than many think.
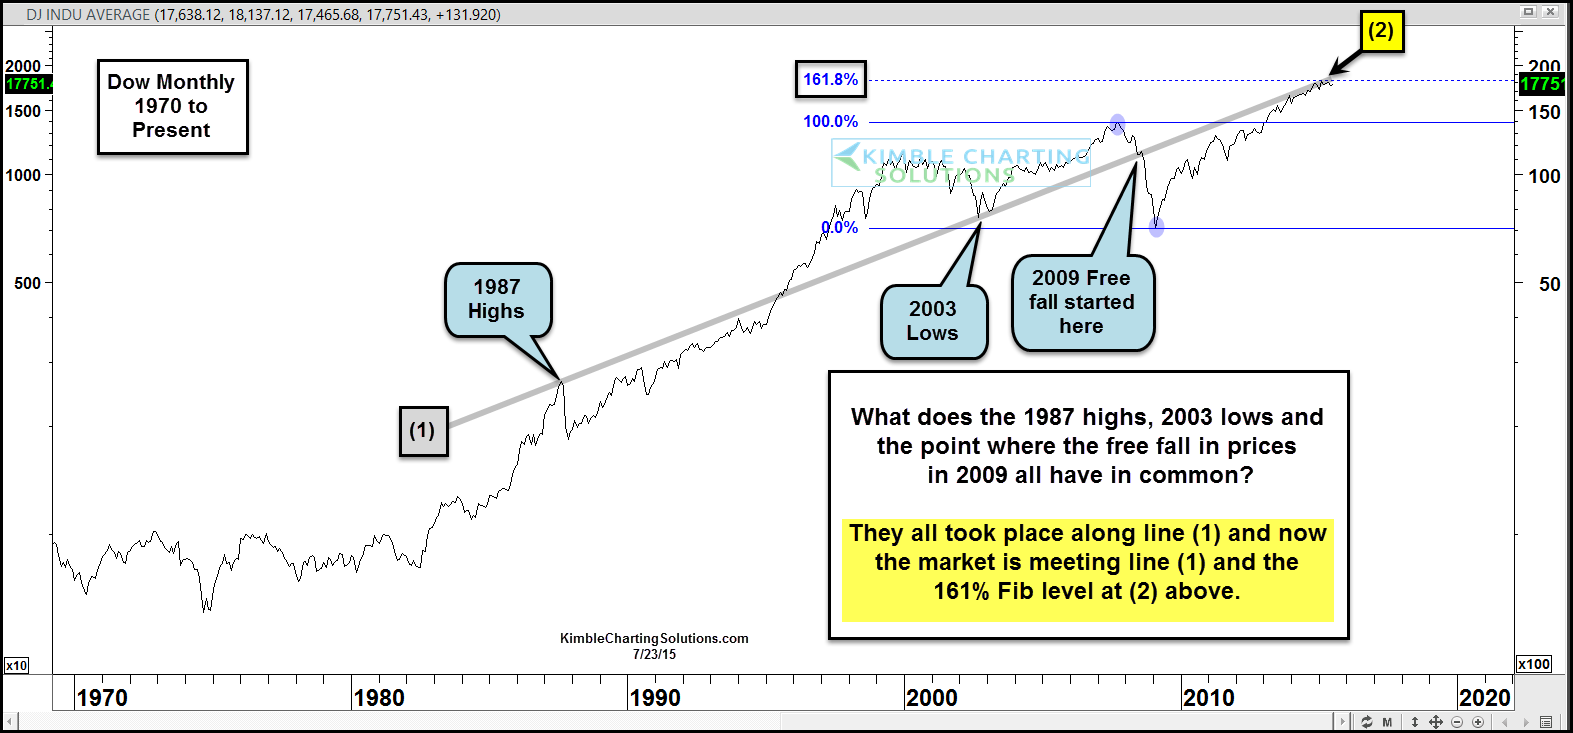
Check out the chart below. It dates back to 1970 and highlights a key trend line for the Dow Jones, connecting from the 1987 highs through the 2003 lows. This line also indicates where the 2008 free-fall in stocks accelerated lower. The Dow Jones is once again bumping up against this line.
But the Dow Jones isn’t the only stock market index that’s hitting significant resistance levels. The Dow Jones, S&P 500, and German DAX have all touched up near there respective 161.8 Fibonacci extension levels. And note that the Nasdaq is back at levels last seen in 2000. See charts below.
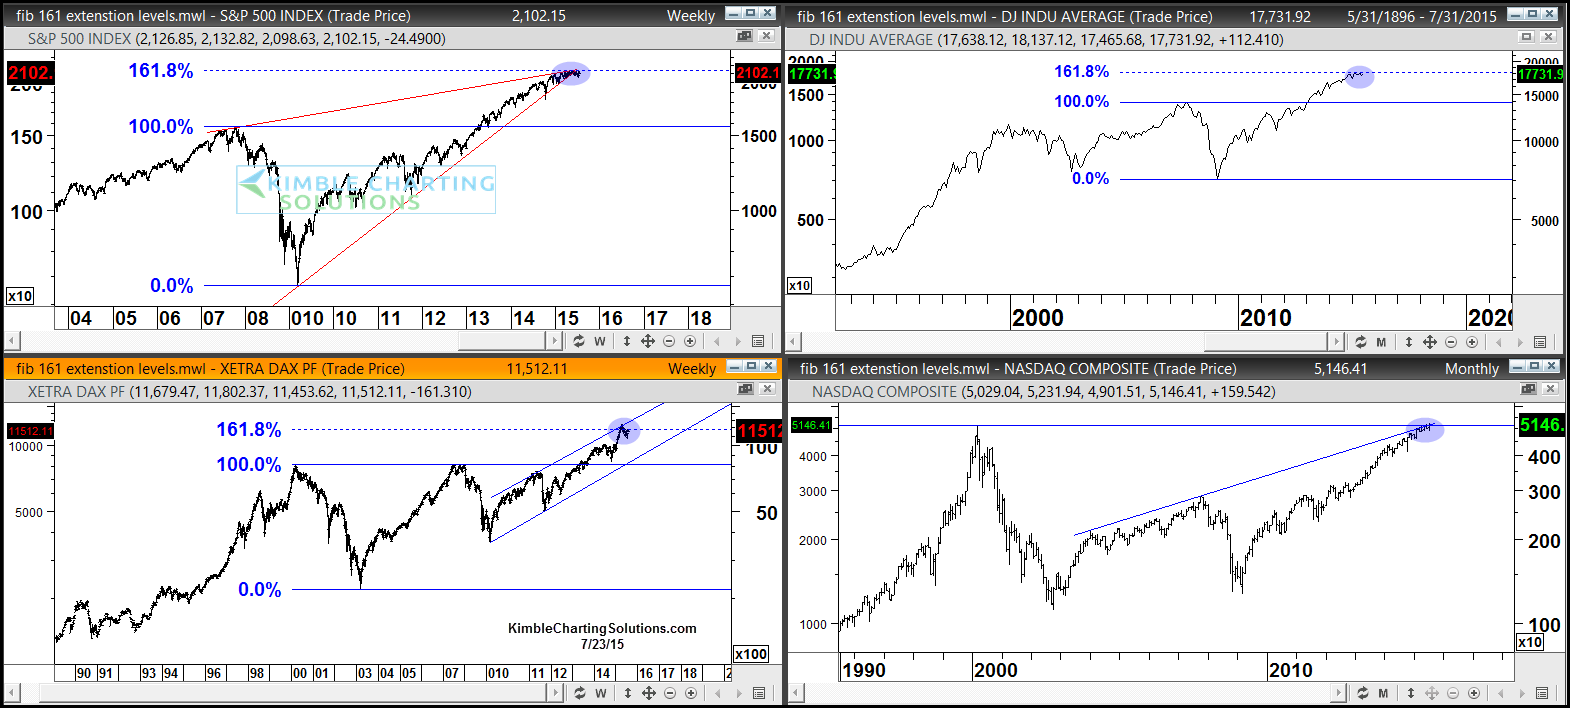
These levels have come together in and around the same time, marrying together time and price. And, in my humble opinion, this is a strong reason why the markets have not been able to breakout for much of 2015.
So keep an eye on the highs across these major stock market indices – because should a breakout occur, it will likely be a powerful and important one.
Thanks for reading and have a great weekend.
Twitter: @KimbleCharting
Author does not have a position in any mentioned securities at the time of publication. Any opinions expressed herein are solely those of the author, and do not in any way represent the views or opinions of any other person or entity.

 Rolling Over At Key Fibonacci Level?")


 Rolling Over At Key Fibonacci Level?")
