Stock Market Weekly Outlook & Technical Review – September 30
Here’s a look at some key stock market indicators and emerging themes that we are watching in our latest “Stock Market Outlook”:
Small-Cap Stocks Enter Fourth Quarter With Wind At Their Back – The Russell 2000 Index (INDEXRUSSELL:RUT) and fellow small-cap stocks continue to gain strength relative to large-caps. This is a trend seen from both a price and market breadth perspective. From a seasonal perspective, history suggests small-cap stocks could experience some pre-election jitters, but a Q4 low could be followed by seasonal strength that carries well into 2017.
Overseas Leadership Still Coming From Emerging Markets – European stocks have gained strength versus the U.S. over the course of the third quarter, but the longer-term trend favoring U.S. leadership remains intact. The relative leadership from Emerging markets (versus their Developed counterparts) that has been seen in 2016 remains intact and shows little evidence of subsiding.
Active Investment Managers Remain Fully Invested – Some short-term pessimism has been seen in our sentiment work, but we are also seeing signs of persistent optimism. Outside of a few outliers, active investment managers have shown little evidence of paring back equity exposure and other sentiment polls have shown a new up-tick in optimism.
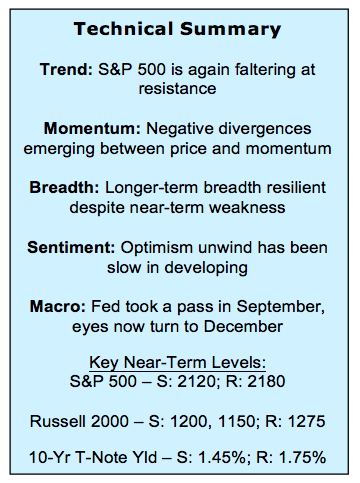
Stock Market Indicators – S&P 500 Weekly Outlook
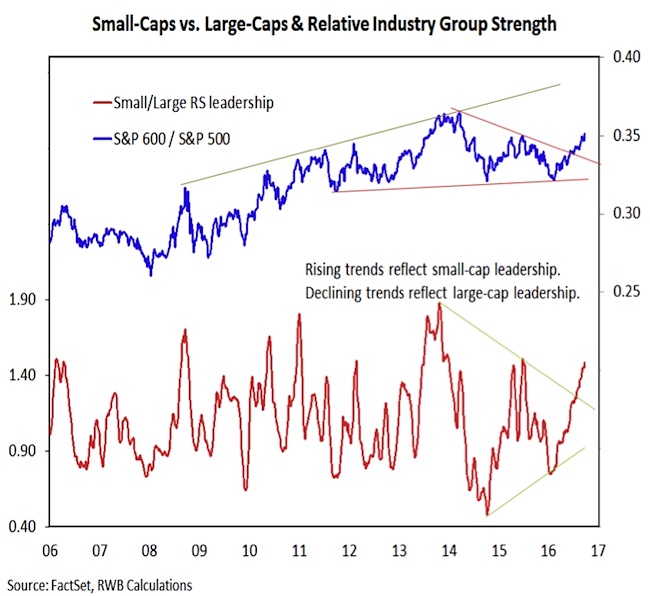
Russell 2000 – Small Cap Stocks
Small-caps have broken out of a multi-year relative strength down-trend versus large-caps. This can be seen from a price perspective (the ratio between the small-cap S&P 600 and the large-cap S&P 500) but also from a breadth perspective. In our industry group relative strength rankings, small-cap groups have surged this year relative to their large-cap counterparts. This provides small-caps with a base of support should election-related jitters weigh disproportionately on them (although so far they have not).
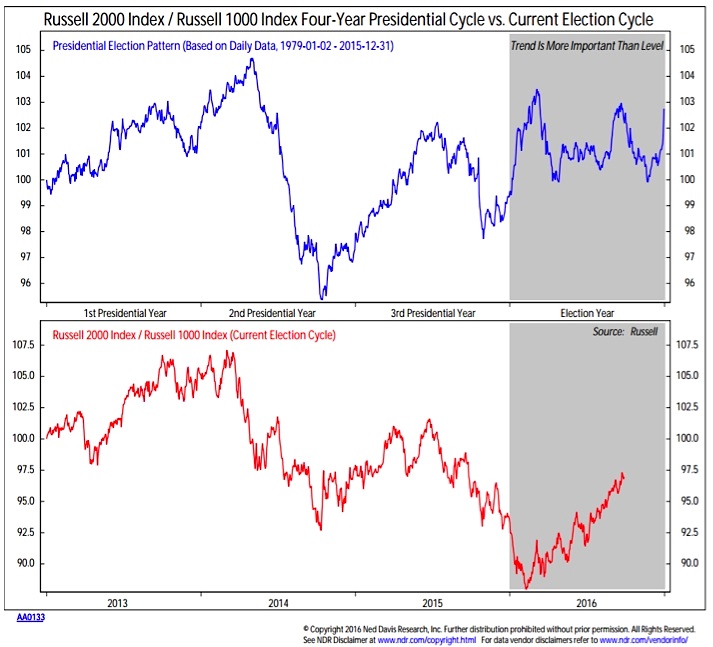
The seasonal pattern in small-caps versus large-caps suggests we could yet see relative weakness in small-caps as we move toward the November elections. However, this has tended to be followed with renewed strength in small-caps that could carry well into the first year of the new President’s term. The improved performance by small-caps this year stands in stark contrast to what was seen over the course of 2015 and seems to suggest underlying strength in the stock market overall.
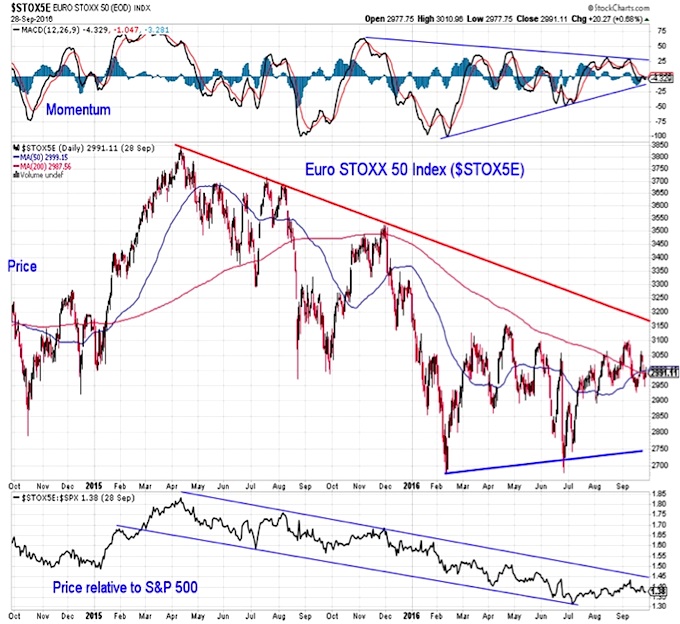
Overseas Markets
European stocks have bounced in the third quarter, but there is little evidence that this signals a meaningful turn in either absolute or relative price trends. Relative to the S&P 500, the STOXX index remains in a well-defined down-trend channel and looks to be faltering near resistance. On an absolute basis, the STOXX has not cleared its early-year highs from a price perspective and momentum is facing an important test of support.
Overseas leadership continues to come from emerging markets (EM). The early-year strength out of EM (especially relative to developed markets) has been sustained. There is little evidence that EM is reading to give up leadership. Momentum is trending higher in a well-defined channel (turning higher now at support) and the price ratio continues to climb. Similar to the leadership in domestic small-caps, relative strength in EM in 2016 stands in sharp contrast to what was seen last year.

continue reading on the next page…
 Rolling Over At Key Fibonacci Level?")


 Rolling Over At Key Fibonacci Level?")

