Last week saw another week of selling in the stock market – fast controlled selling. But it gave way to another sharp oversold rally on Thursday after the S&P 500 undercut its lows. And the price action on Friday looked quite similar to January 20th although there were some positive divergences emerging over the very short term.
All bounces thus far have ended at either the 38.2% Fibonacci retracement or the 50% retracement on shorter timeframe charts (hourly etc.).
The path of least resistance is still down as all of the stock market indices are still below their 50 and 200 day moving averages and pointing downwards. Investor sentiment is very poor but nothing extreme. And there still is a lot of complacency on either side of the tape. As well, volatility continues to be elevated.
In my humble opinion, we have not seen the capitulation low type move yet so be careful. That said, this move higher may have some legs so it’s important to use discipline when trading this tape.
Economic reports this week include:
- Housing Starts, PPI-FD, Industrial Production and FOMC Minutes on Wednesday
- Jobless Claims, Phily Fed Business Outlook Surevey, Leading Indicators and EIA Petroleum Status Report on Thursday
- Consumer Price Index on Friday.
Additionally there are quite a few Federal Reserve representatives talking throughout the week.
Market Breadth Indicators:
From a market breadth indicator standpoint, the following are worth keeping an eye on.
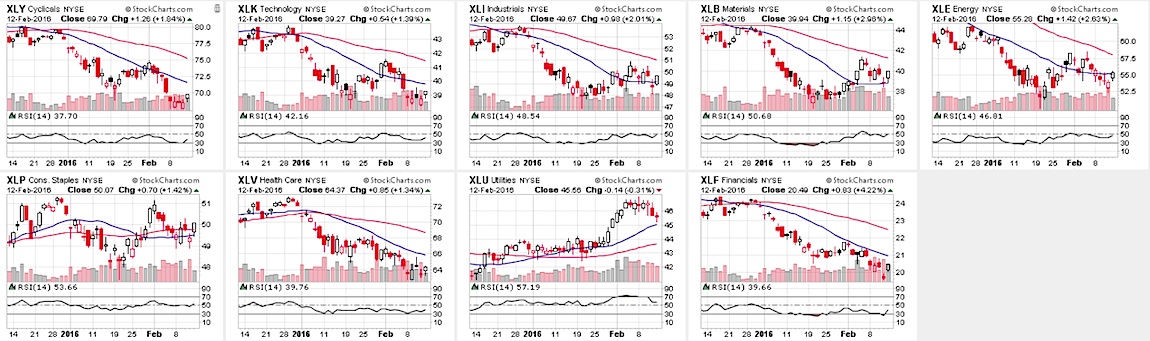
Sector Performance: Candlestick glance:
From sector performance standpoint, none of the sectors are oversold. Financials ($XLF) and Cyclicals ($XLY) entered the week near oversold but most sectors have worked that off this week. Most of them are still in a serious downtrend while Utilities ($XLU) seems to have worked off its overbought condition.
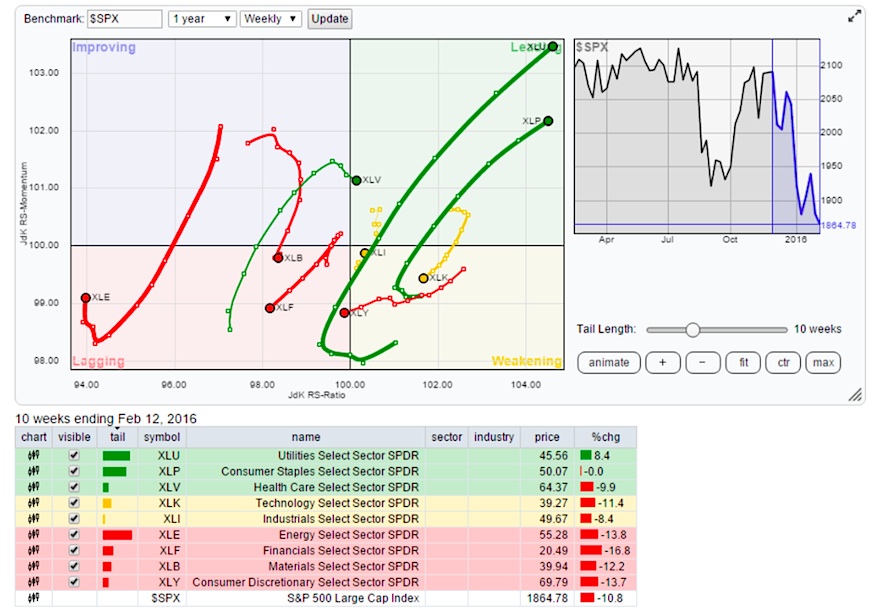
The Relative Rotation Graph (RRG) chart showing the leaders and the laggards among the 9 sectors heading into this week.
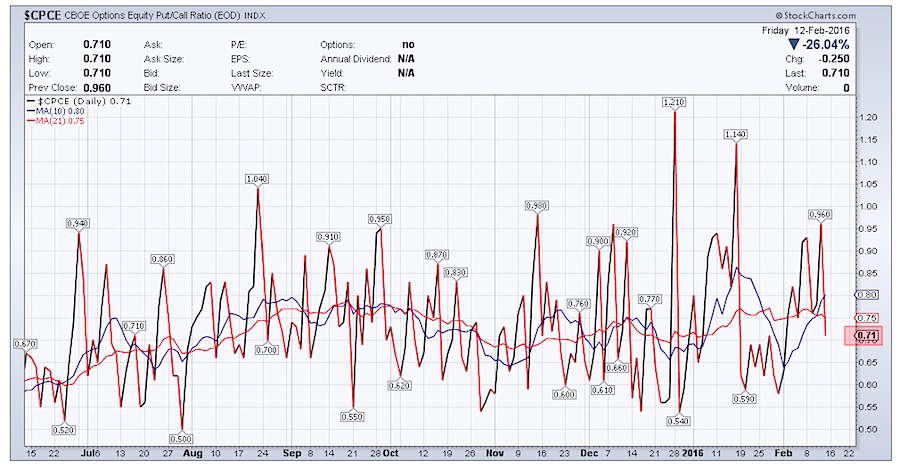
$CPCE – CBOE Options Equity Put/Call Ratio:
The CBOE Options Equity Only Put/Call Ratio spiked twice last week before easing off on Friday. It hit 0.96 which shows some fear but nothing indicating a capitulation type low. Anything over 1.00 or more importantly 1.10 signals extreme fear where there are more number of puts than calls. It finished the week at 0.71. The rally continues but investors are still on alert.
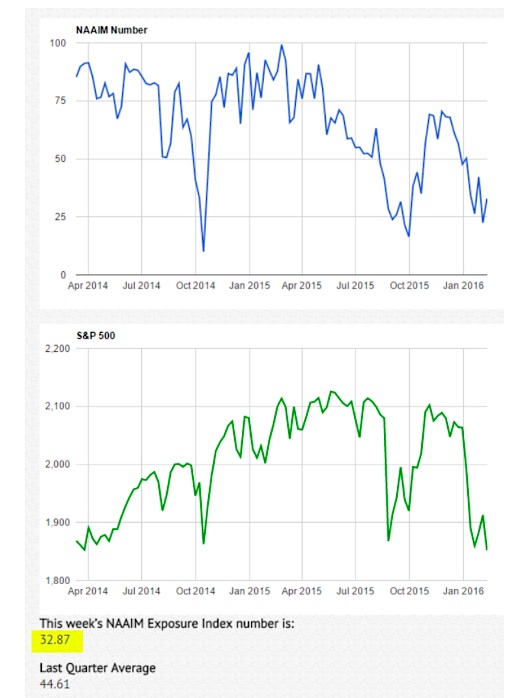
NAIIM Exposure Index Reading – 42.25:
The NAAIM Exposure Index is a great investor sentiment indicator and represents the average exposure to US Equity markets. The green line shows the close of the S&P 500 Total Return Index on the survey date. The blue line depicts a two-week moving average of the NAAIM managers’ responses. As shown below, a week ago, the Index number had fallen back to the lower range towards 22.41. Last week it increased to 32.87 but still low enough for the mean reversion type move in the stock market indices to continue (which we are seeing this week).
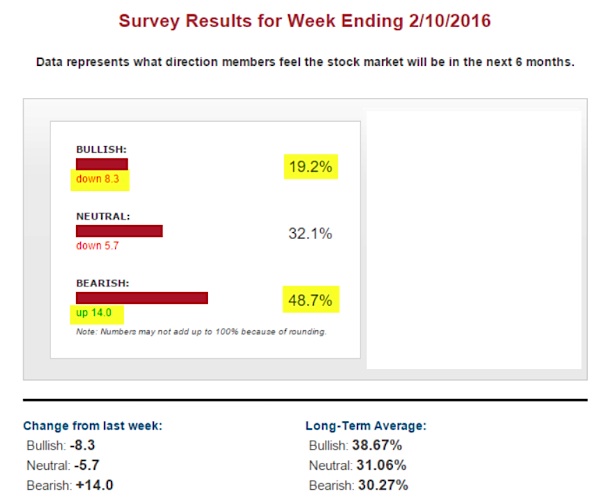
AAII Bulls:
The AAII investor sentiment survey ending 2/10 suggests that the AAII Bulls were down 8.3 or 19.2%. It is probably matching or near the lows from July last year. This is a positive for the bulls over the short term and could support a mean reversion move.
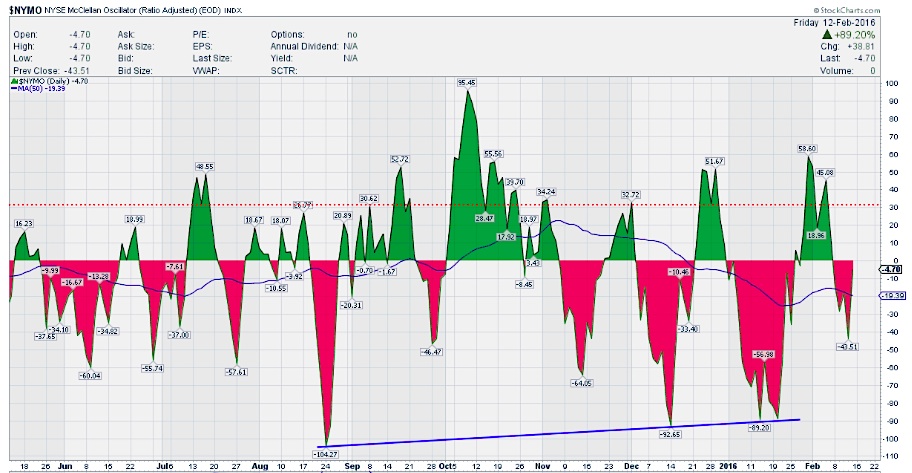
$NYMO (McClellan Oscillator):
The McClellan Oscillator (NYMO) finished the week at -4.70, almost flattish towards the zero line. This was neither overbought nor oversold but the move Thursday and Friday offered momentum into this week.
S&P 500 Index – $SPX:
The S&P 500 closed the week at 1864.78. Last week I outlined a couple of scenarios on Stocktwits and Twitter.
- $SPX moves higher, the next target is right above to the declining 8 SMA at around 1869.93 or overshoot to 1872 and fall lower to retest 1850-1848 before resuming higher towards 1900+.
- From Friday’s close, retest 1850-1848 zone or even 1840 zone and then move higher towards declining 8 SMA at around 1870, consolidate a bit and move higher towards 1884 and with a small chance to 1900-1905.
A move towards 1900 will get many uncommitted shorts to cover and new longs to emerge and just above that level is a potential spot where a new leg lower could begin. We are still in a long term downtrend and possibly in a bear market with price below key moving averages. Some skepticism may breed higher prices and mean reversion. And a move to the 1920-1940 zone is not ruled out either. Keep an open mind, but stay disciplined.
Thanks for reading.
Twitter: @sssvenky
The author has a position in S&P 500 related securities. Any opinions expressed herein are solely those of the author, and do not in any way represent the views or opinions of any other person or entity.
 Rolling Over At Key Fibonacci Level?")


 Rolling Over At Key Fibonacci Level?")


