Today we’ll look at some potentially bullish setups on the broader stock market indices.
We’ll look at the Dow Jones Industrial Average (INDEXDJX:.DJI), S&P 500 Index (INDEXSP:.INX), NYSE Composite (INDEXNYSEGIS:NYA), and global stocks.
Momentum Failure Can Be Positive
It is counterintuitive to think a “momentum failure” set-up in stocks could have bullish implications. In this case, the description from stockcharts.com is helpful:
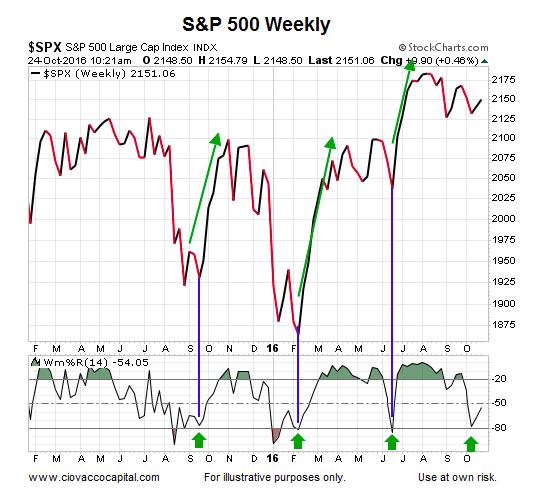
Momentum Failure: The failure to move back into overbought or oversold territory signals a change in momentum that can foreshadow a significant price move. The ability to consistently move above -20 is a show of strength. After all, it takes buying pressure to push %R into overbought territory. Once a security shows strength by pushing into overbought territory more than once, a subsequent failure to exceed this level shows weakening momentum that can foreshadow a decline.
The present day weekly chart of the S&P 500 below shows an example of the case where momentum fails “to move back into oversold territory” (below -80). It is important to understand the difference between a set-up and a confirmed set-up. The chart below illustrates the first step or a set-up. In order for the set-up to be confirmed, the momentum indicator (Wm%R) needs to experience a weekly close above the center line (-50).
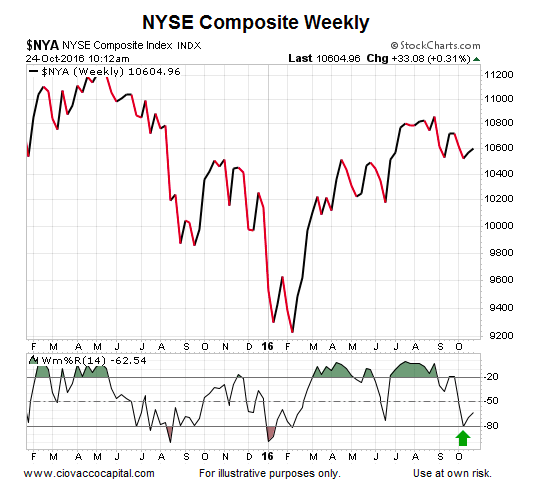
A similar set-up can be found on the chart of the NYSE Composite, telling us if the set-up is confirmed, it may have broad implications above and beyond the S&P 500.
Have Numerous ETFs Broken Below Important Retracements?
This week’s video puts some context around recent weakness in numerous ETFs, including technology (QQQ), metals (DBB), REITS (IYR), emerging markets (EEM), oil (USO), mid-caps (MDY), and dividend stocks (DVY).
More on ETF’s…
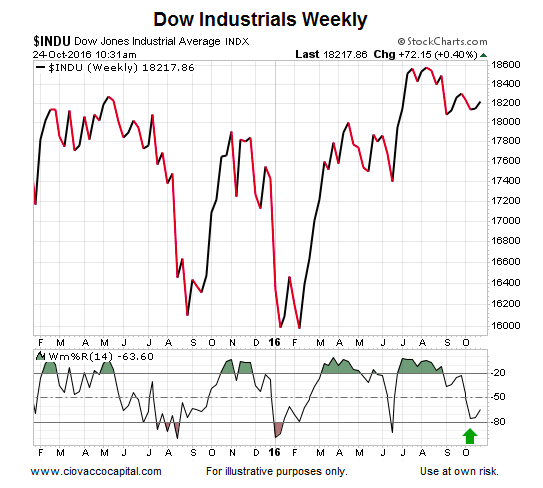
Although the Industrials sector (NYSEARCA:DIA) has been lagging the S&P 500 for several months, the same potentially bullish set-up appears on the chart of the Dow Jones Industrial Average.
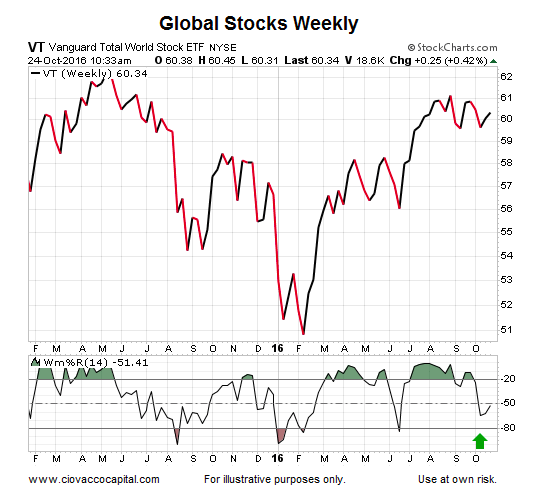
The set-up is broad and extends outside the United States, as illustrated with the weekly chart of global stocks (VT) below.
Set-ups mean very little until a confirmation is in place, something that may happen on either Friday, October 28 or Friday, November 4. However, this set-up aligns with information covered on October 10, September 6, and August 20. Thanks for reading.
Twitter: @CiovaccoCapital
The author or his clients may hold positions in mentioned securities at the time of publication. Any opinions expressed herein are solely those of the author, and do not in any way represent the views or opinions of any other person or entity.


