 Well, it’s finally Friday. What a week. The deep move lower for stocks on Monday and gyrations that followed will give traders plenty to think about into the weekend.
No doubt, the stock market rally off the lows (at least thus far – it’s only mid-day!) has taken some of the edge off, but the market is far from out of the woods.
I’ve been on vacation all week, but managed my time and the markets well (I think). As I wrote about in my market update on Monday evening, I scaled into equity exposure (trading positions) on Friday and Monday… and I scaled out of them with the rally into yesterday. Staying focused on my plan allowed me to carry on and enjoy my vacation with my family.
The next stage will likely be difficult to navigate. The S&P 500 Index has rallied over 6 percent off the lows and setups in individual stocks and the major indices may take some time to develop. And “stops” are still an important piece of the puzzle as we are only 4 days removed from Monday’s lows.
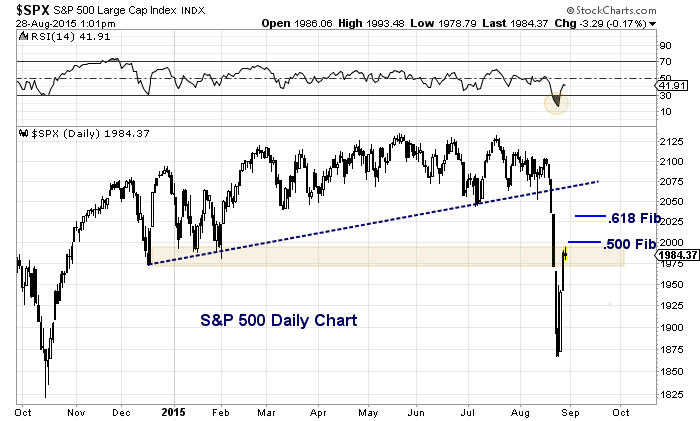
Below is a chart of the S&P 500 including some key resistance levels to put on your radar. As you can see, the 50 percent Fibonacci resistance level at 2000 will be the first hurdle. That zone also includes prior lows from December and January. Should the stock market rally push through that S&P 500 resistance level, then the focus will turn to the 61.8 Fib level at 2032. Just above that is the 2040 level (March/July lows).
On the flip side, if/when the stock market turns lower, traders (and investors) will need to determine what levels are actionable (whether buying or selling). Fibonacci retracements will help (once a high is in), as will stops. But as I mentioned earlier, it’s always best to have a plan. That tends to save you from yourself in volatile markets.
S&P 500 Daily Chart
Thanks for reading.
Sign up and receive our investing research and trading ideas in your inbox. No strings; it’s free.
Twitter: @andrewnyquist
The author does not have a position in any of the mentioned securities at the time of publication. Any opinions expressed herein are solely those of the author, and do not in any way represent the views or opinions of any other person or entity.

")


