 What a difference a week makes.
The market ended the previous week on a strong note. And the S&P 500 seemed poised to follow the Nasdaq Composite and push to new all-time highs. But these and any other bullish hopes for the stock market were swiftly extinguished as the market put in an ugly reversal last week that resulted in a good deal of technical damage.
The S&P 500 and Nasdaq both lost more than -2% last week and this was despite some spectacular earnings from the likes of Amazon (AMZN).
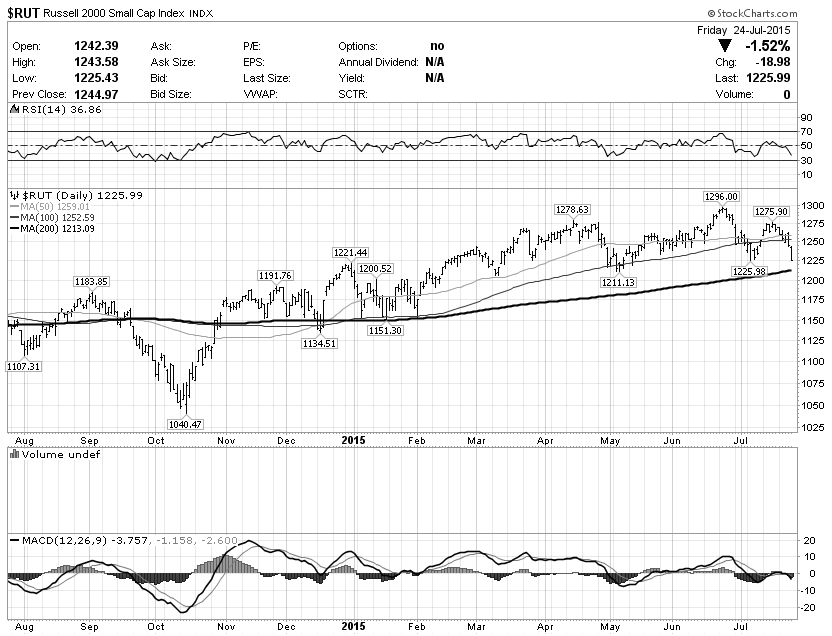
The Russell 2000 took the worst beating among the major stock market indices and shed close to -3.5% last week. On multiple timeframes, the Russell now looks like it may be putting in a major topping pattern.
Needless to say, the uptrend is again under threat and weakness is becoming more widespread.
The following is a review of select stock market and sectors indices and ETFs:
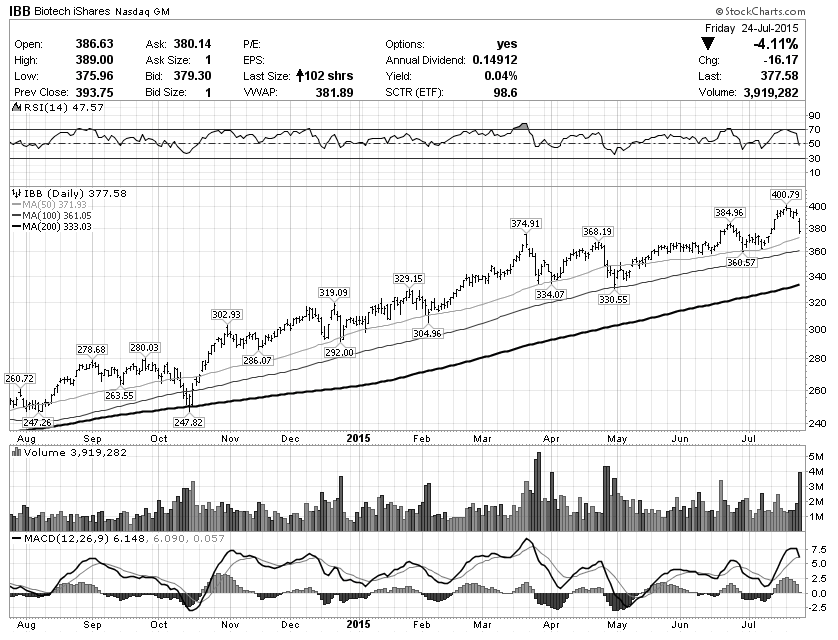
STILL THE LEADER
Biotech Index (IBB): Lost almost -5% for the week, but still remains above the key moving averages and within a long rising channel.
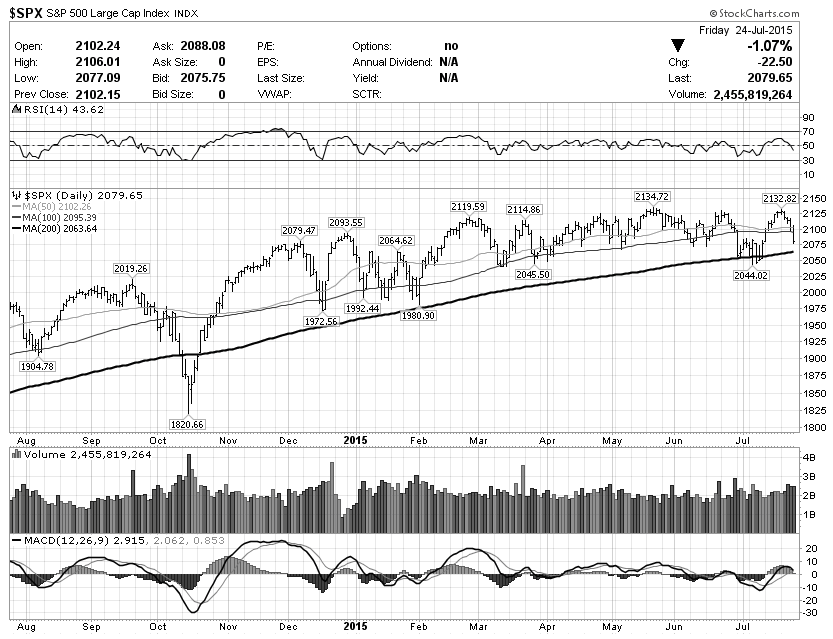
REJECTED
S&P 500 (SPX): Started the week trying to follow the Nasdaq and break out to new all-time highs but got rejected and closed the week under the 2100 level as well as the 50 and 100 dmas. Looks like the path of least resistance is lower toward support in the 2045-2050 area.
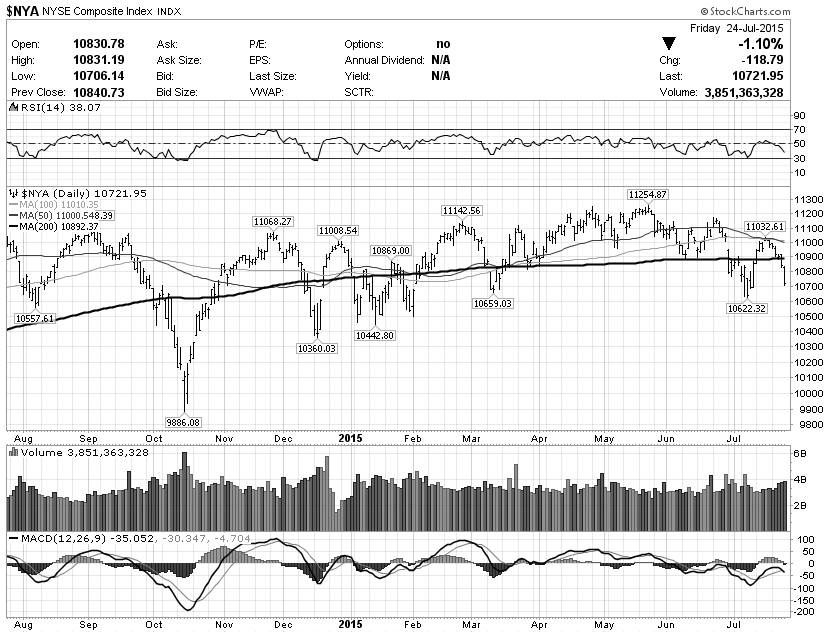
MAJOR TOP?
NYSE Composite (NYA): This broad index is among the worst looking major indices. The 200 dma has been flat for the past four or so months, the index closed the week under it, and the overall price pattern looks like a combination of a big rounded top and a Head-and-Shoulders.
AT THE NECKLINE?
Russell 2000 (RUT/IWM): Closed at the neckline area of what looks like a sloppy four-month Head-and-Shoulders topping pattern. Should the neckline around 1220-1225 fail, next major support is around 1150.
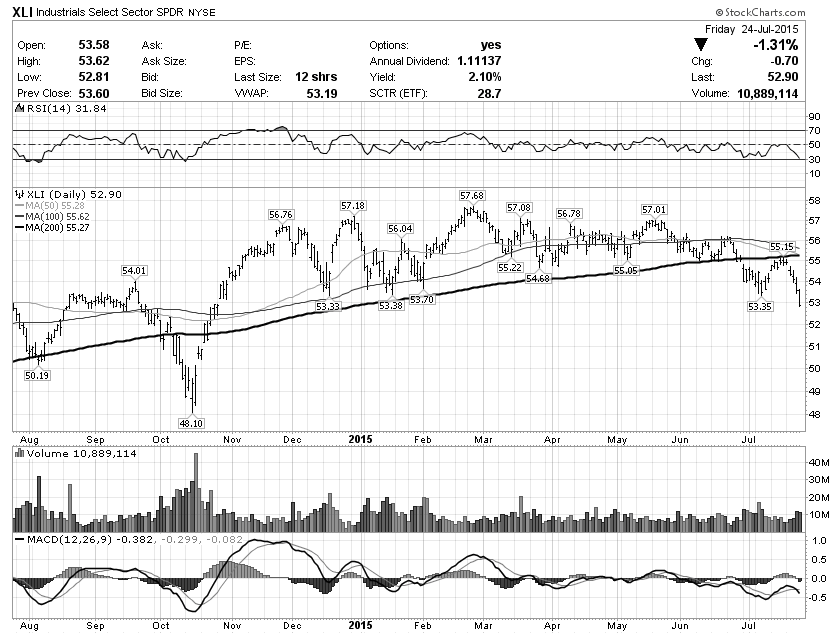
HEADED FOR BEAR MARKET?
Industrials Sector (XLI): A long consolidation pattern turned into a topping pattern. Industrials are leading to the downside and have been under the 200 day moving average (dma) for most of July. The middle of the month brought a textbook bounce and re-test of the resistance at 200 dma, followed by a rejection and a close at new 2015 lows.
There are many more examples of weakness out there and at this point it is difficult to be bullish.
Having said that, I have seen several smart market overview posts over the weekend arguing that many sectors and indicators have reached severely oversold conditions and these conditions have historically led to rallies.
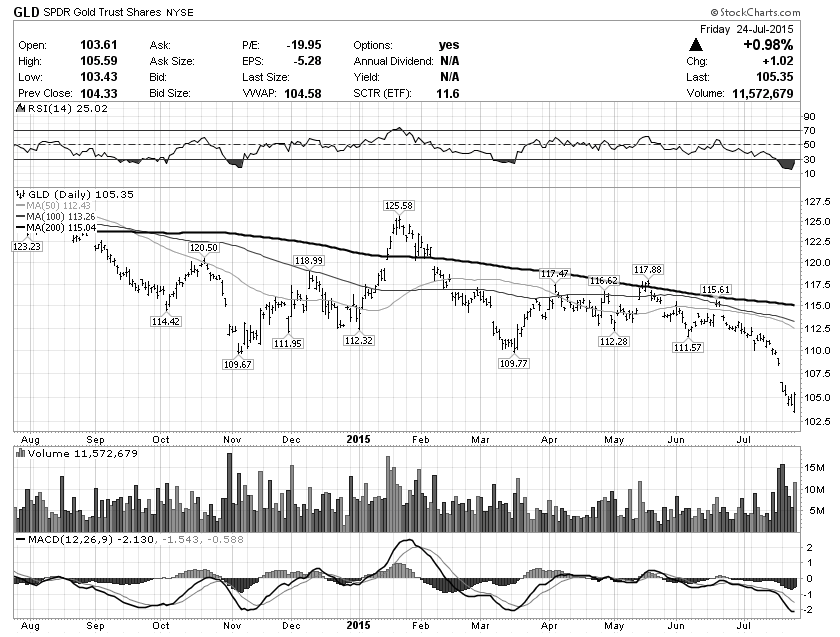
A good example is the gold sector (GLD, GDX, etc.), which has reached rarely seen oversold levels last week and put in a possible bullish reversal bar on Friday, see the Gold ETF chart below.
SPDR Gold Shares ETF (GLD)
It should not be surprising to see some kind of a rally attempt in the coming week. However, the weight of the evidence points to a significant amount of weakness and technical damage, which leads me to believe the stock market may be undergoing a more significant shift.
Consequently, I would personally view any bounces and rallies with extreme caution and possibly as opportunities to start short positions.
Twitter: @NoanetTrader
Read more from Drasko’s blog, NoanetTrader.
Any opinions expressed herein are solely those of the author, and do not in any way represent the views or opinions of any other person or entity.

")


