What We Are Watching
This Week’s Stock Market Outlook:
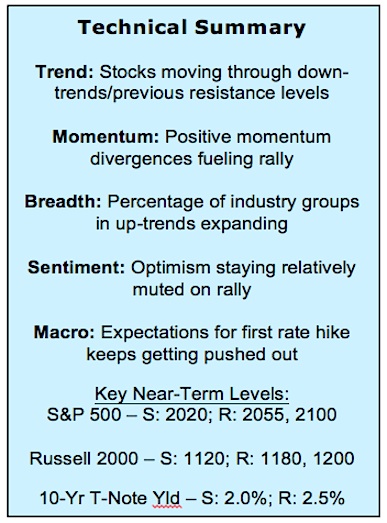
Indexes Challenging Downtrends, Resistance – As the October stock market rally has expanded, price and momentum downtrends are being challenged. The year-long down-trend in momentum for the S&P 500 has been broken, and this has helped price break above what loomed as key resistance levels near 2020 and again near 2040.
Breadth Back to Neutral – The percentage of stocks trading above their 50-day averages has soared from single digits to better than 60% as the broader stock market has stabilized. The number of industry groups in uptrends is expanding, and we recently saw more weekly new highs than new lows on the NYSE for the first time since May.
Optimism Building Slowly – With price and momentum trends improving and breadth stabilizing, the biggest near-term risk for stocks would seem to be a rapid return to optimism on the part of investors. So far that has not been the case. Equity mutual funds have continued to see outflows, and active investment managers have not aggressively increased equity exposure (last week it actually declined according to NAAIM).
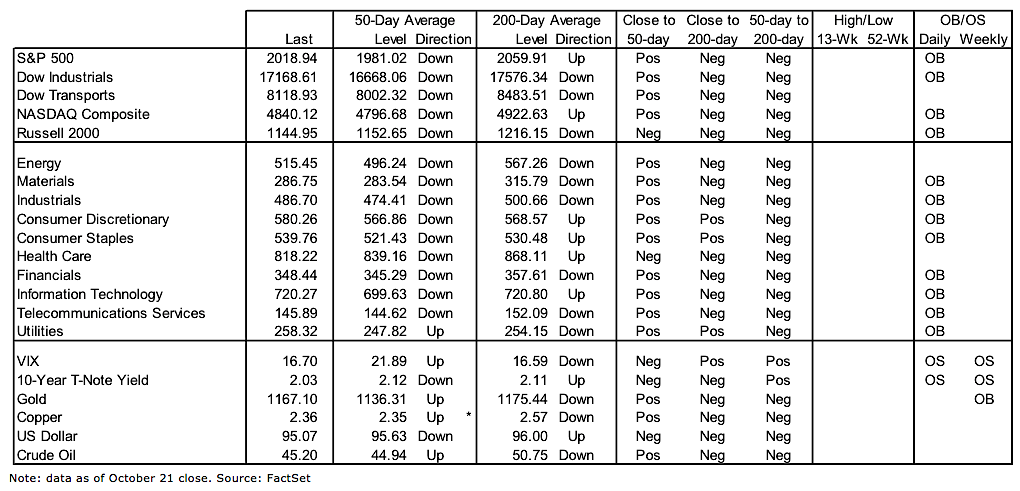
Stock Market Indicators – Indices & Sectors (click to enlarge)
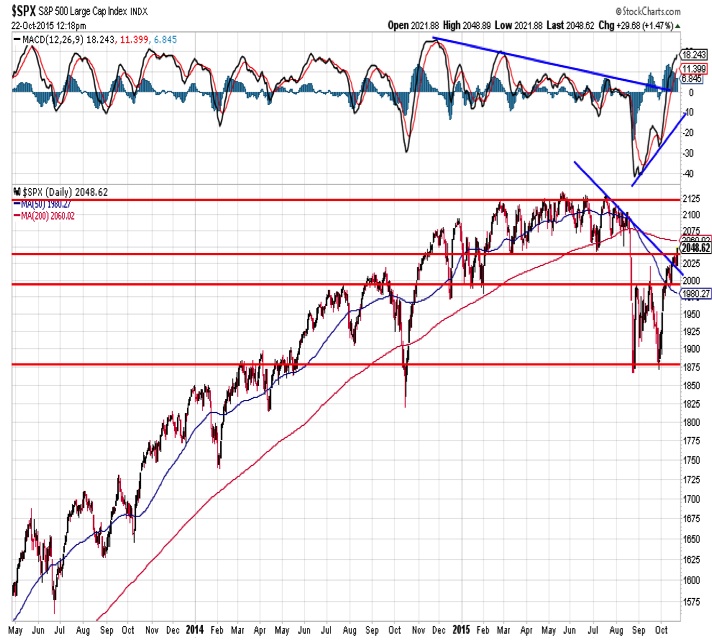
S&P 500 Index
Momentum leads price. Following the positive momentum divergence on the September re-test of the price lows, upside momentum has continued to expand on the S&P 500. This has broken the year-long momentum downtrend and has helped sustain the price rally. Additional evidence of the strength of the emerging uptrend in stocks could come on any consolidation that breaks out higher.
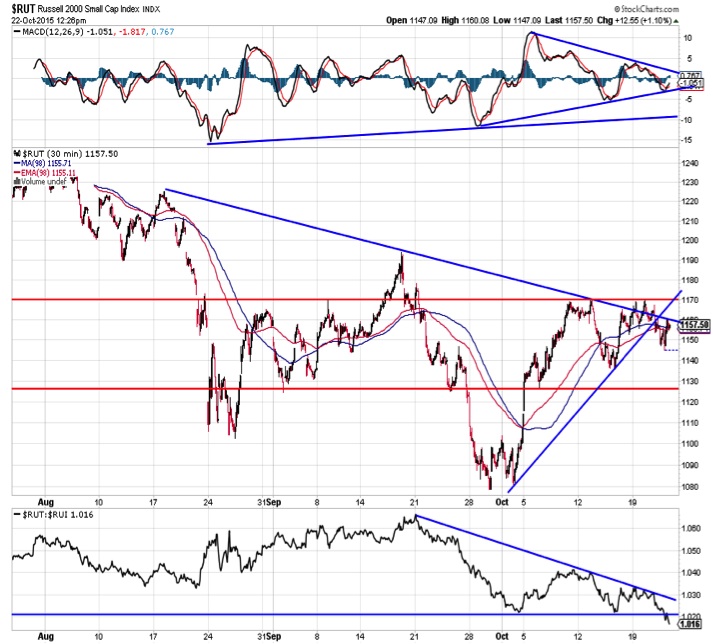
Russell 2000 Index
Small-caps have ceded the leadership position they gained coming off of the initial August lows, and the Russell 2000 failed to hold support at those lows on the September re-test. The Russell 2000 has continued to struggle to match the gains being posted by large-cap stocks. This is further evidence that this year’s October rally is not a carbon copy of what was seen last year and may be evidence that a protracted period of large-cap leadership lay ahead.
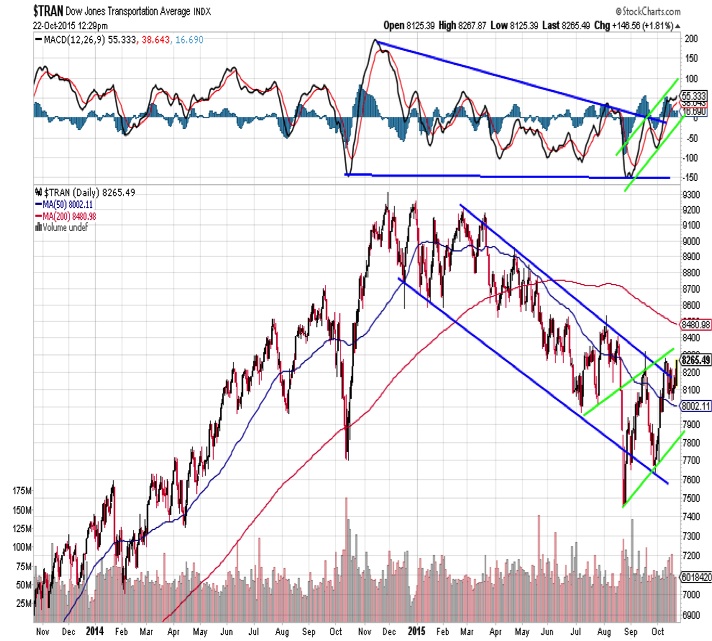
Dow Jones Transportation Average
The Dow Transports provided an early warning of the weakness for the overall stock market, trending lower in the first half of the year as sideways trading ranges emerged elsewhere. Evidence of the opposite can now be seen. An uptrend emerged for the Transports emerged off of the August lows even as other areas of the market consolidated. Both price and momentum have made a series of higher lows and higher highs, a sign that the trend is pointing higher for stocks.
continue reading on the next page…


