In my mind, it’s as simple as ALL futures stock market open gaps eventually get filled. It just takes patience and a system that works for spotting trends and reversals (trend changes).
Those are the words I left you all back in November 2015 when I was forewarning of a coming pullback for stocks. I also proposed that not all investors would want to hear the gloom of markets turning down and so my partial words of wisdom may have simply been put on the shelf with all the other naysayers.
Truth be told, I had no guarantee when it would happen, but that eventually the probability was increasing.
As a contributor to market analysis, at the end of the day the market is a 50/50 split for those that get it right and those that get it wrong. We write (and trade0 with probabilities. And we use them to assess risk that the market will head in a certain direction. For those of us who got it right, we wave our flags high and inform you all that we knew it all the time.
So it’s a lot easier taking a macro approach and applying a trend following system to it. And my approach is that all stock market open gaps (for major indices) eventually get closed.
And building off the prior article, I’m writing today to inform you that we closed them in the first week of trading for 2016.
Starting out the first week of 2016, it was the TF (Russell 2000 futures) in retreat that started what was to be a following by the other three major stock market indexes.
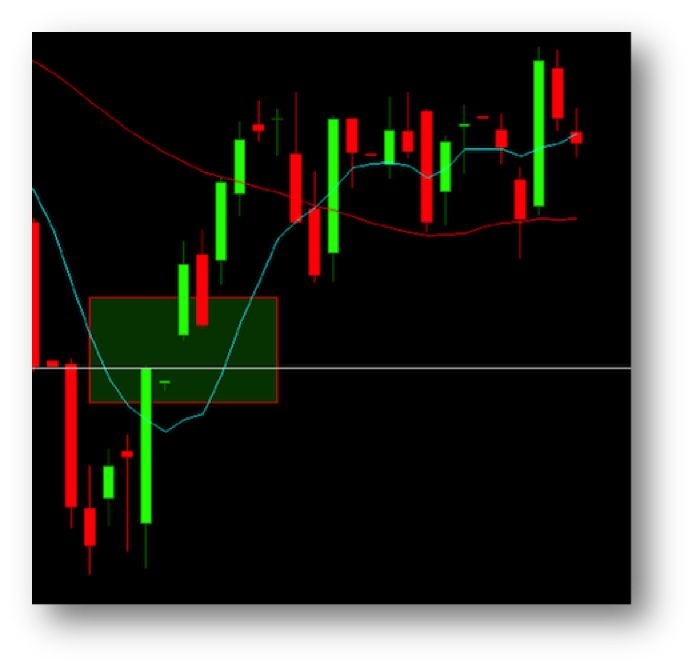
The open gap on the Russell 2000 futures in regular trading hours indicated by the shaded area back in November was an area by all means that would eventually be closed. BUT, by no means does this mean that opportunities did not exist in the interim, though.
At what juncture did the probability increase that these stock market open gaps would close? Let’s start with the Russell 2000.
Based on a bit longer-term charts (see below), I access probabilities. Adding in the intraday charts can either increase or decrease these percentages. When bias forms to the downside, percentages above 75% in the RED will be a good indicator that we are headed to close the open gaps.
As seen here, on December 8th, 2 out of the 6 charts that I observe, clearly had shifted to the downside indicating an technical bias that may lead to close out the open gap. While the longer term charts had shifted to the short, it was the short term swing charts (4 hour) that had the next leading bias only to be followed by the intraday setup.
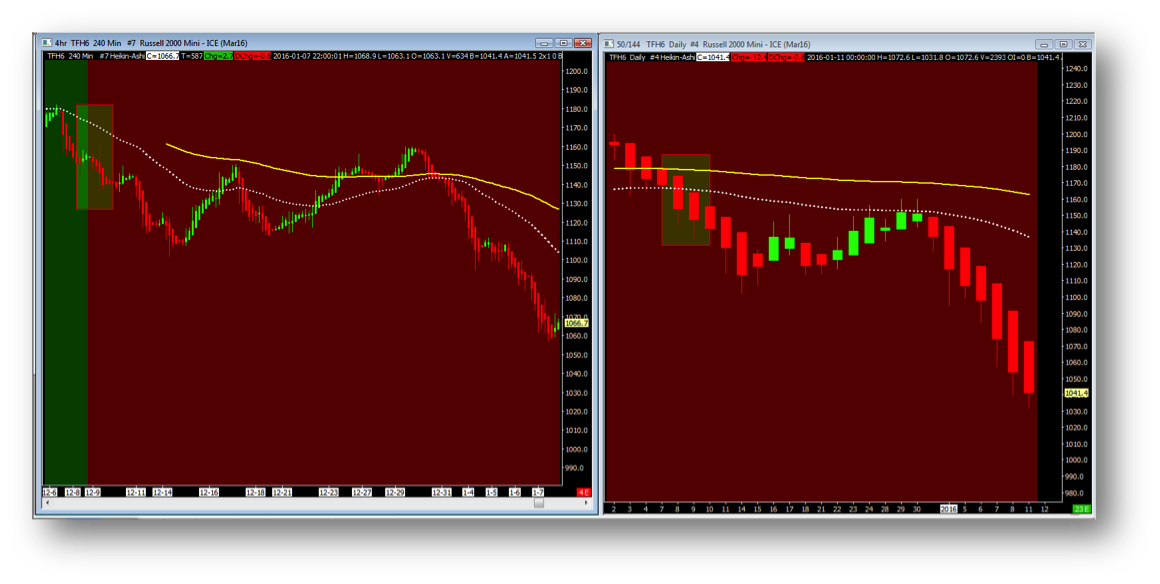
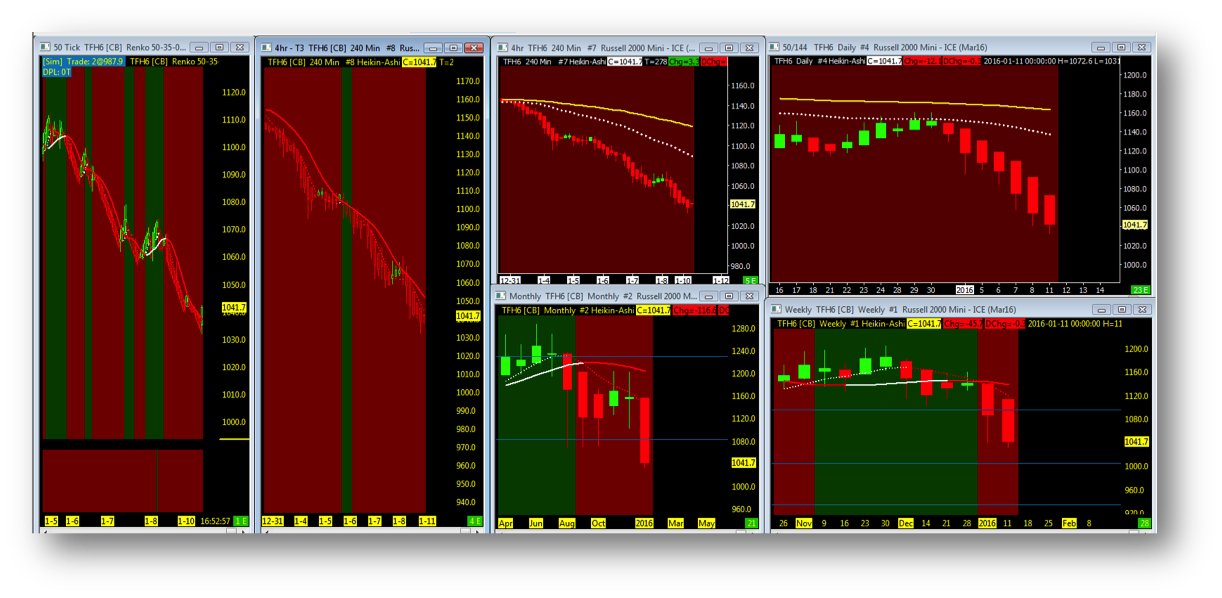
With all 6 charts in sync to the short side, it was at that time that the market had the greatest probability of closing out the daily open gaps.
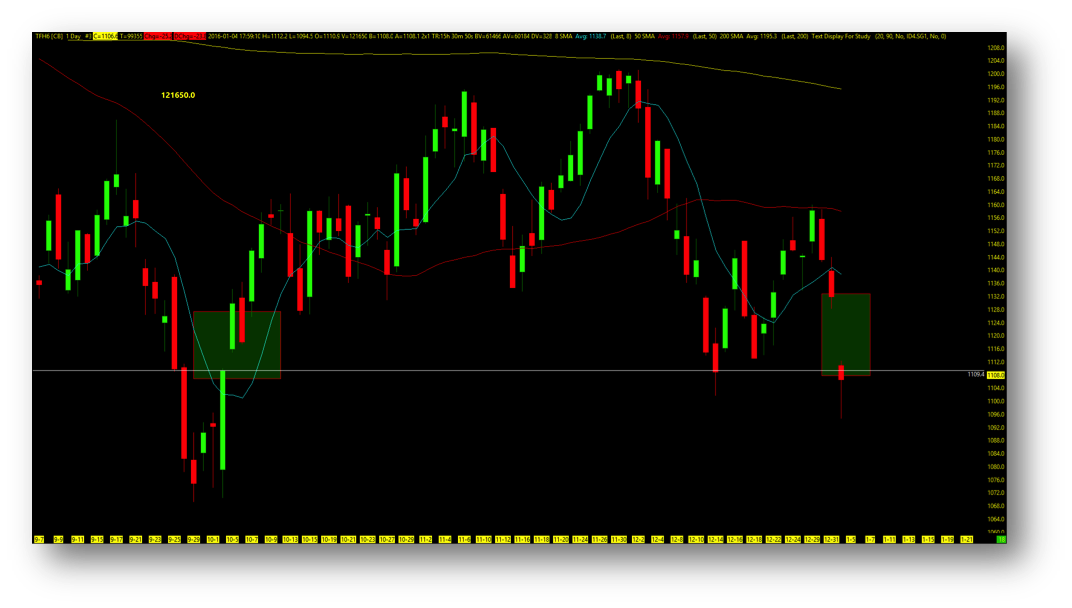
As seen here on a chart for the Russell 2000, one of the key stock market open gaps was closed on the left by the price action on the right reaching 1109.4 and closing out the “gap hole” that existed for three months.
What about the other three major stock market indices?
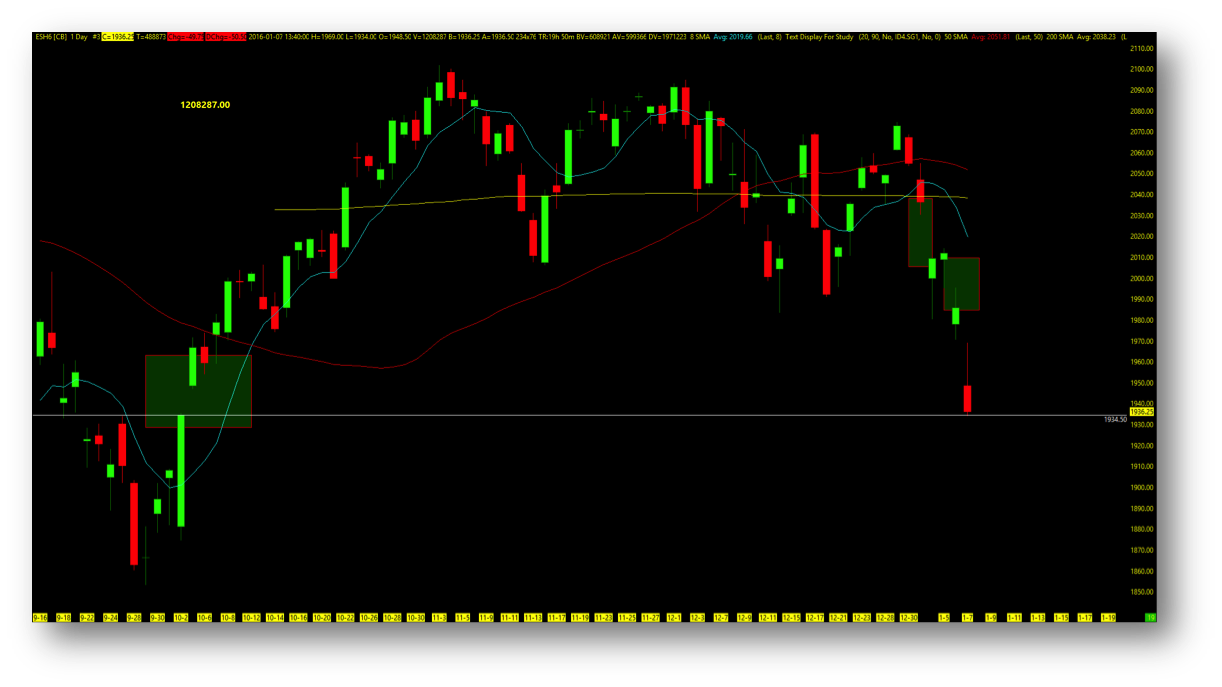
4 days later, the ES mini S&P 500 futures closed out it’s open gap from October 5.
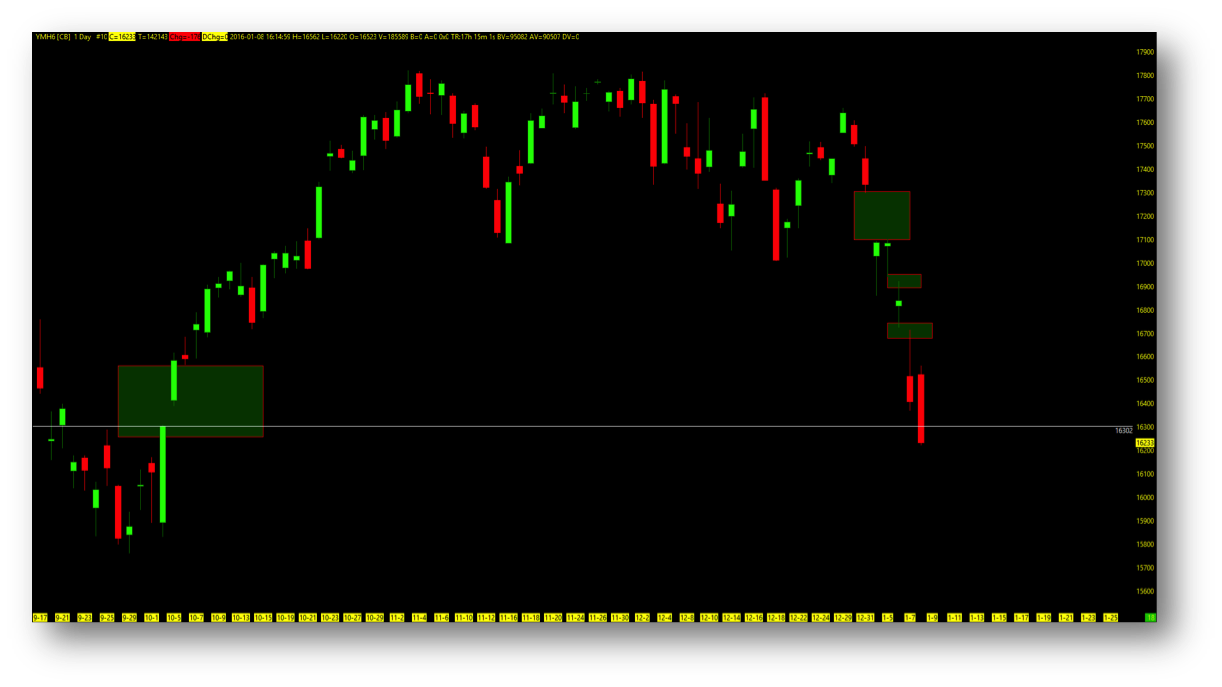
In sync with the ES, the Dow Jones futures (YM) closed its Open Gap from October 5.
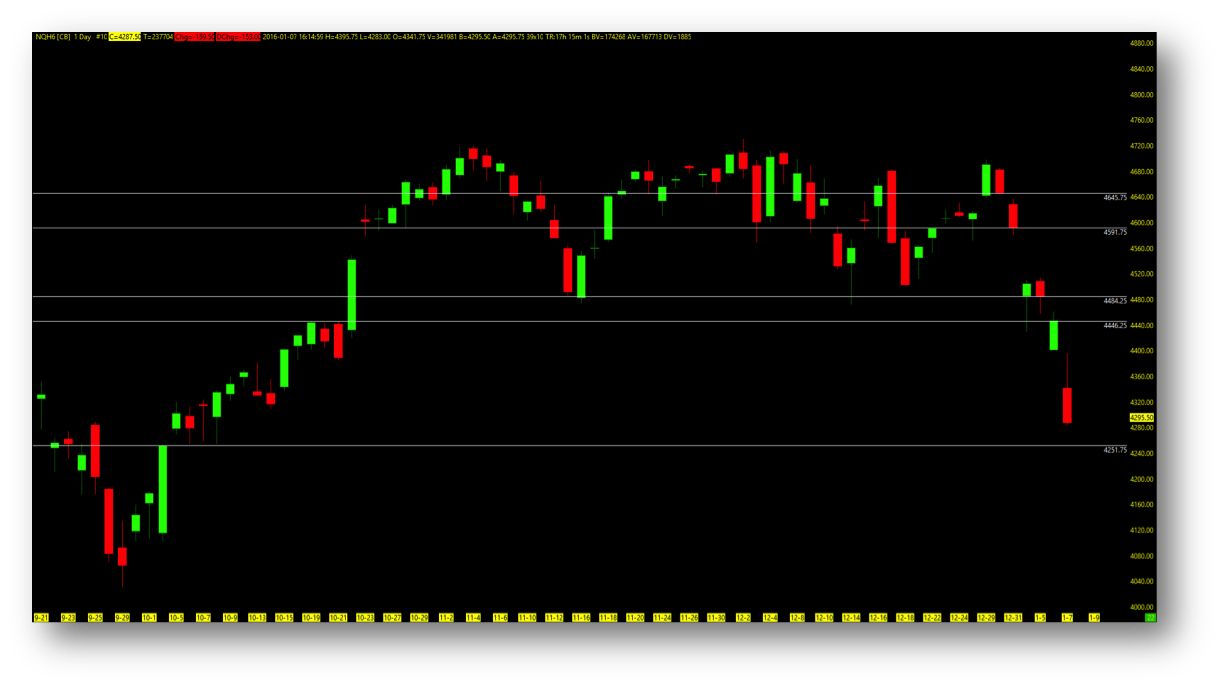
The Nasdaq 100 futures (NQ), on a last attempt in the last hour of trading for the 1st week of 2016 came within several points of closing out its open gap. Note that this open gap was closed in early trading this week.
Knowing now that we have closed these major stock market open gaps, where does that leave us and what may come next?
Before we get ahead of ourselves, it’s good to note that the market still has room to move lower on all 4 stock market indices in conjunction with market and volume profile open points of control. We know the market to never move in one direction without price retracement and an opportunity to buy in an area of value may currently exist.
Whether we continue lower or not, one thing is for sure. We now have left open gaps to the upside that will all eventually be closed out. But we have to be patient and wait for a trend change before we target these stock market open gaps.
continue reading on the next page…

 Rolling Over At Key Fibonacci Level?")


