Stock market futures outlook for May 4 – S&P 500 futures made several attempts to breach and hold a key support level around 2060.5 (noted in yesterday’s post) and it failed. And, as suspected, we advanced lower into that baseline level of 2046.
We’ve lost that level as well, but it seems clear to me that buyers will try to structure a bounce off support near 2040.5. But if S&P 500 futures fail to recapture 2048 on the bounce event, we’ll have another negative day ahead.
If we are able to keep the 2057.5 area on any bounce, buyers will be more likely to add steam to the retrace upward back into resistance near 2068.75. If not, we’ll see the morning lows again, and the drift into 2034 will likely continue. If buyers completely step out of the way, we’ll have that move into 2031. Deep pullbacks like this without any retrace intraday will bring buyers into the fray – watching 2034-2031 for this potential behavior.
Momentum on the four hour chart is negative-suggesting that bounces will be still be sold across stock market futures. Several lines of sellers are poised to prevent the advance of price upward – 2047, 2050.75 and 2053.5. Support levels sit near 2033-2031.
See today’s economic calendar with a rundown of releases.
THE RANGE OF TUESDAY’S MOTION
Crude Oil Futures (CL_F)
May 4 outlook for Crude Oil – The API report showed a build. There is an EIA report today out at 10:30 eastern. Crude Oil is holding support near 43.3, but that support could be soft into 42.9 and if the EIA report shows a greater build that the API build, we’ll run the risk of coming into 42.3before bouncing into what will likely be a lower high.
The rading range for crude oil futures suggests support action near 43.24, and resistance behavior near 44.34.
Upside motion on crude oil futures is likely on the positive retest of 44.15, or a positive retest of 42.9 with positive momentum. I often use the 30min to 1hr chart for the breach and retest mechanic. Targets from 42.9 are 43.3, 43.68, 43.9, 44.11, 44.45, 44.68, 44.92, 45.14, 45.42, 45.72, 46.05, and if we can catch a bid there, we could expand into 46.53 to 46.94, but that seems extremely unlikely here today.
Downside motion is trending into support levels currently being tested, and the short trade seems feasible below the failed retest of 43.24 or at the failed retest of 44.34 with negative divergence. Retracement into lower levels from 44.34 gives us the targets 44.11, 43.94, 43.78, 43.53, 43.34, 43.03, and perhaps 42.9, to 42.68, and 42.34.
E-mini S&P 500 Futures (ES_F)
Below is a S&P 500 futures chart with price support and resistance trading levels for today. Click to enlarge.
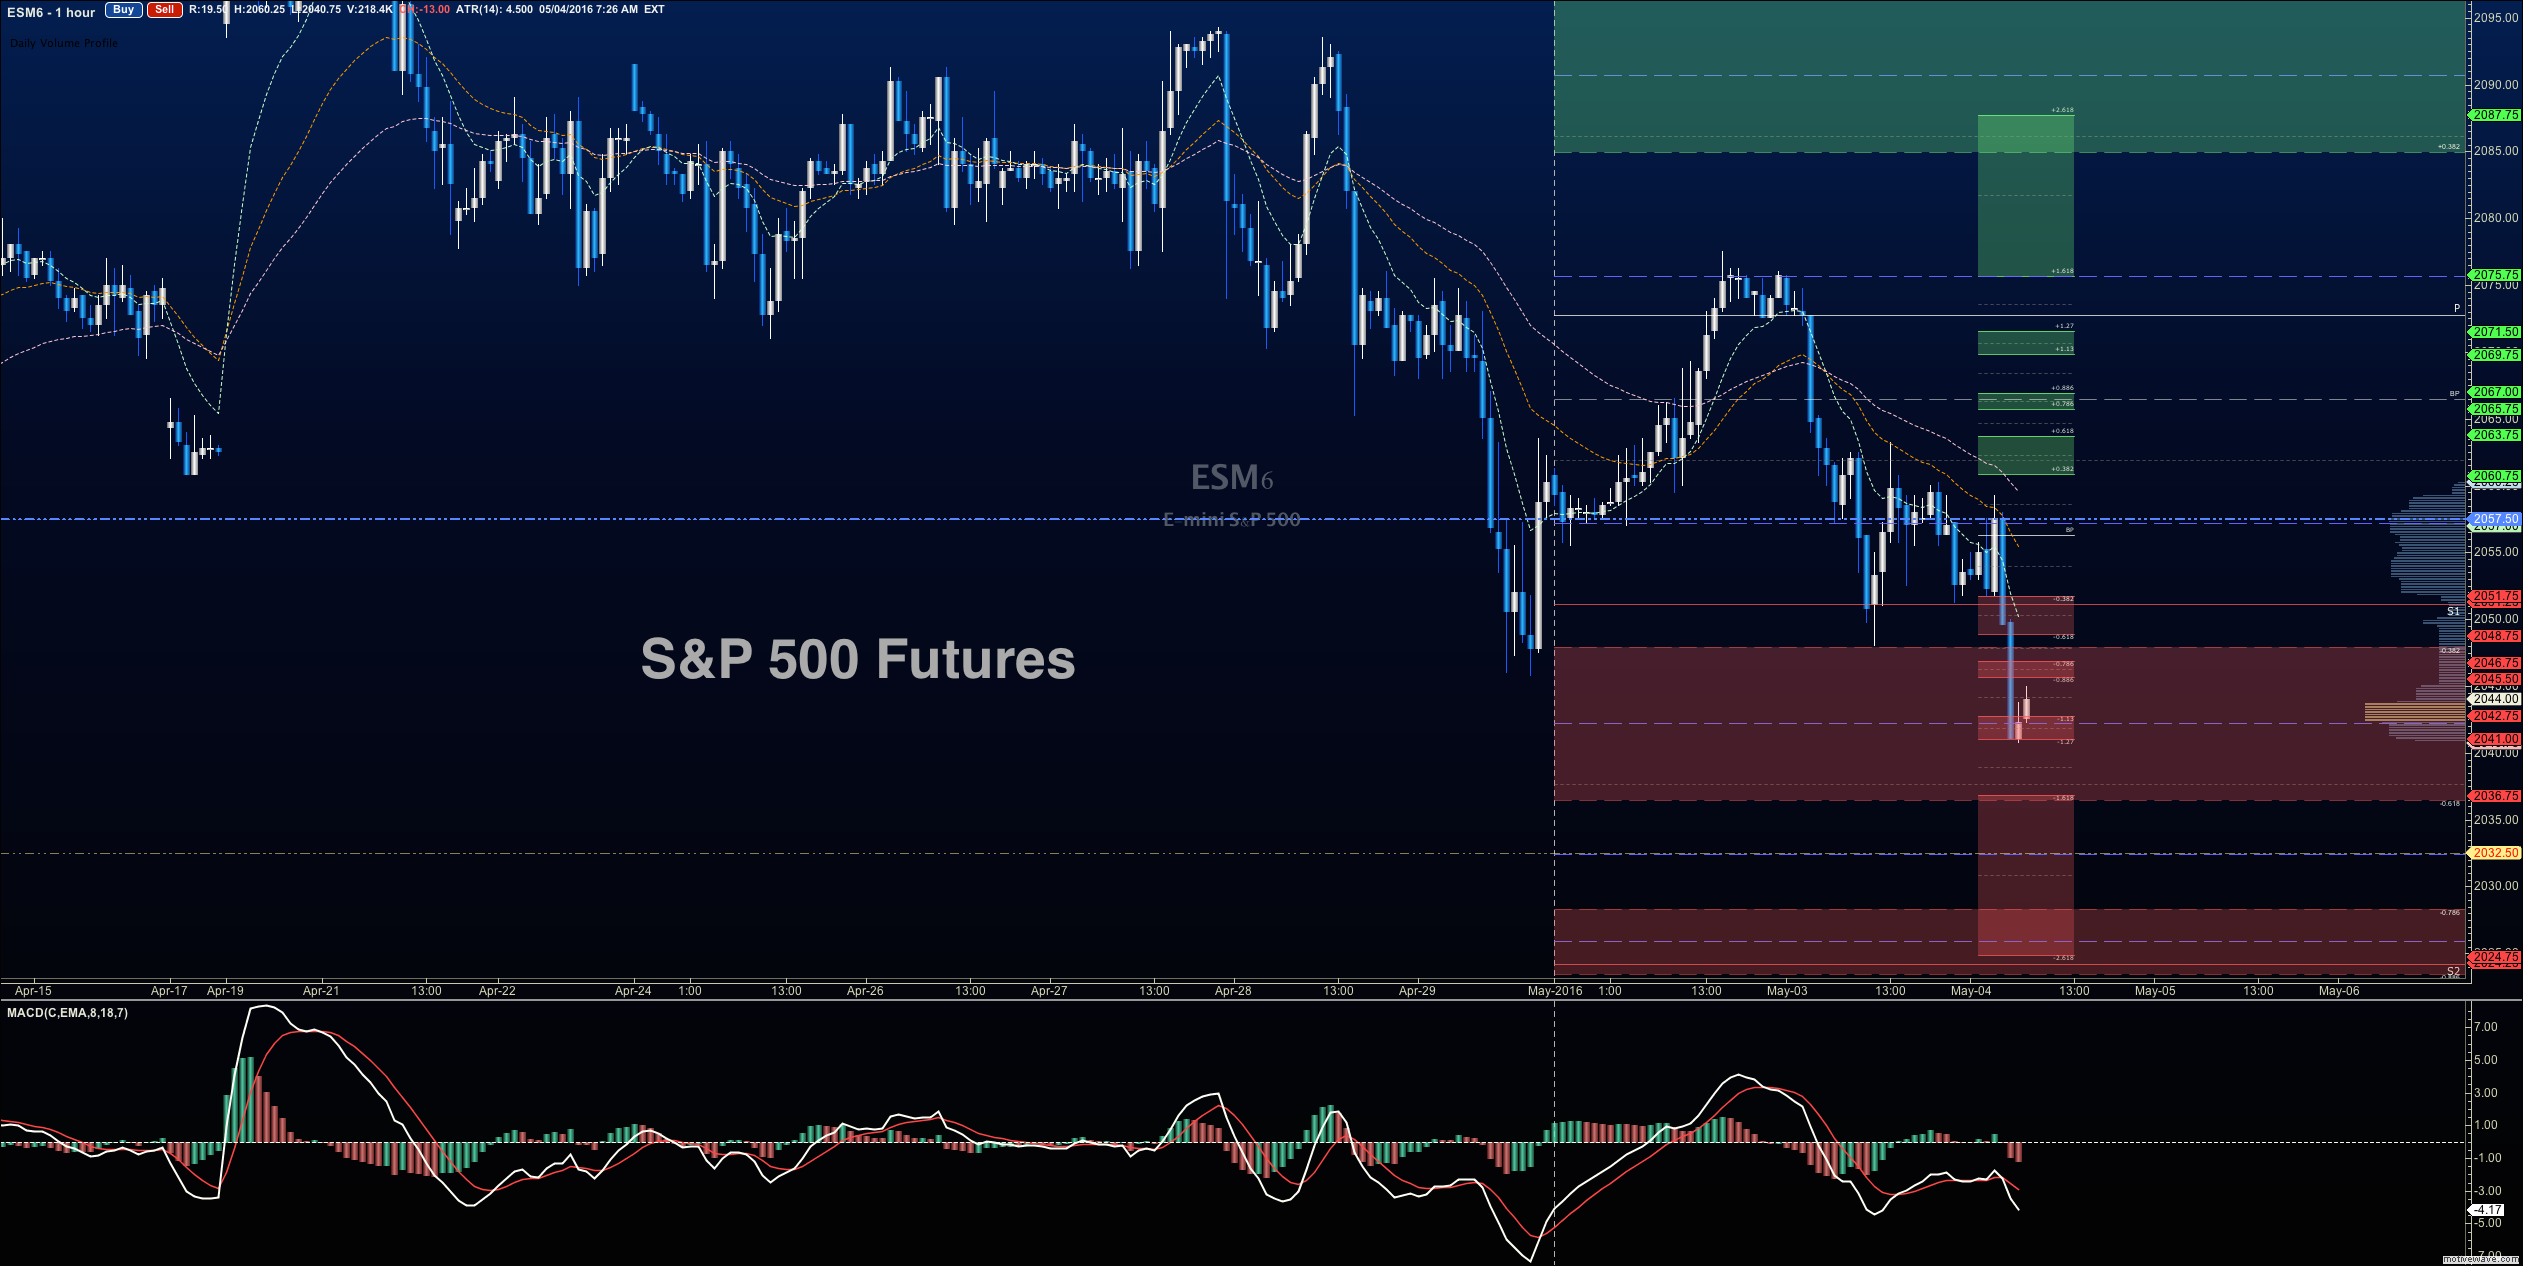
S&P 500 Futures Outlook for May 4 – Negative momentum with negative trend took the lead yesterday once more after a weak bounce into a lower high completed into the close.
Stock market futures upside motion continues to be countertrend on the 4 hour time frame in mind, but the best setup sits on the positive retest of 2053.5, or a bounce off 2036.5 with positive momentum – keep your eyes on 2044.25 with this 2036.5 entry. I use the 30min to 1hr chart for the breach and retest mechanic. Targets from 2036.5 are 2038.5, 2042.5, 2044.25, 2047.25, 2049.75, 2051.5, and if we can catch a bid there, we could expand into 2053.5, 2057.25, and 2060.5.
Long action on S&P 500 futures is still trending over the bigger picture for now, but momentum continues to slow, and pullbacks seem quite frequent at resistance zones, raising concern on the strength of trend holding.
Downside motion opens below the failed retest of 2053.5 or at the failed retest of 2040 with negative divergence. Retracement into lower levels from 2053.25 gives us the targets 2051.5, 2048.75, 2046.5, 2040.5, 2037.75, 2034.5, and perhaps 2031.25 to 2029.25.
If you’re interested in the live trading room, it is now primarily stock market futures content, though we do track heavily traded stocks and their likely daily trajectories as well – we begin at 9am with a morning report and likely chart movements along with trade setups for the day.
As long as the trader keeps himself aware of support and resistance levels, risk can be very adequately managed to play in either direction as bottom picking remains a behavior pattern that is developing with value buyers and speculative traders.
Twitter: @AnneMarieTrades
The author trades stock market futures every day and may have a position in mentioned securities at the time of publication. Any opinions expressed herein are solely those of the author, and do not in any way represent the views or opinions of any other person or entity.


")


