April 29 stock market futures outlook – After a bounce off support in the morning, stock market futures reversed lower again to retest support. The recent drift in motion suggests that further downside into lower support is quite likely. 2064.5 to 2060.5 – then comes 2054.5, 2051.5 to 2046, and finally a move into 2042 to 2031, if buyers simply step out of the way.
Question is: Will buyers answer the call. So far, it looks like sellers will win this in the short run.
Momentum on the four hour chart is neutral, but falling into negative trending territory. We are trading in regions that give sellers more control in the short term and that means bounces are likely to be sold.
See today’s economic calendar with a rundown of releases.
THE RANGE OF FRIDAY’S MOTION
E-mini S&P 500 Futures (ES_F)
Below is a S&P 500 futures chart with price support and resistance trading levels for today. Click to enlarge.
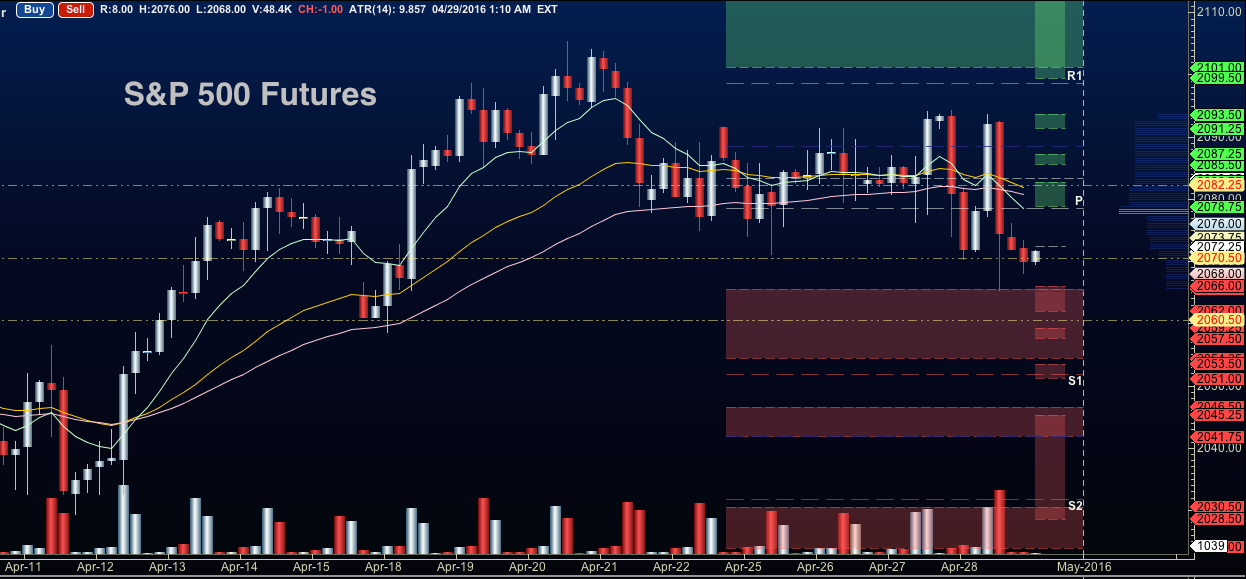
April 29 Stock Market Futures Outlook (ES_F – S&P 500 futures) – An advance of sellers are challenging support levels near 2070.5 and winning for the moment. At some point, buyers should push price action back into 2077.5 to 2082.5, if the balance of power has not shifted properly into selling behavior. If, however, charts cannot recover above 2074.75, we’ll see the lower levels of support tested.
Upside motion on S&P 500 futures is countertrend at the moment, but has the best setup on the positive retest of 2087.75 (over all that congestion), or a bounce off 2067.75 with positive momentum – keep your eyes on 2071.25 with this 2067.75 entry. I use the 30min to 1hr chart for the breach and retest mechanic. Targets from 2071.75 are 2074.5, 2077.75, 2082.25, 2086.5, 2089.5, 2092.25, and if we can catch a bid there, we could expand into 2094.5 to 2097.75. Long action is still trending over the bigger picture for now, but momentum continues to slow.
Downside motion opens below the failed retest of 2074.25 or at the failed retest of 2081.25 with negative divergence. Retracement into lower levels from 2081.25 gives us the targets 2077.75, 2072.25, 2070.5, 2069, 2067.5, and perhaps 2064.5 to 2061.5.
If you’re interested in the live trading room, it is now primarily futures content, though we do track heavily traded stocks and their likely daily trajectories as well – we begin at 9am with a morning report and likely chart movements along with trade setups for the day.
As long as the trader keeps himself aware of support and resistance levels, risk can be very adequately managed to play in either direction as bottom picking remains a behavior pattern that is developing with value buyers and speculative traders.
Twitter: @AnneMarieTrades
The author trades stock market futures every day and may have a position in mentioned securities at the time of publication. Any opinions expressed herein are solely those of the author, and do not in any way represent the views or opinions of any other person or entity.
 Rolling Over At Key Fibonacci Level?")


 Rolling Over At Key Fibonacci Level?")
