Stock Market Futures Outlook for June 1, 2016 – The daily chart shows a measure of technical divergence that suggests that bounces are likely to be sold, and a drift into our deeper support near 2062.5 is on the horizon. Buyers should try to stage a lift near the 2084-2086, but weak buying power should stop the move upward at overhead supply near 2099, and price should drift into 2078-2075 at the minimum. Our moves in the market have been swift, and that builds thin volume profiles that collapse, or expand easily under pressure. We see this happening in oil, as well as the broad indices, quite often.
Momentum on the four-hour chart is sloping negative, but congestion support near 2084 should bring the first fight to the sellers in the process of moving price down. Buyers continue to come to the rescue on the deeper pullbacks and today should be no different. The levels around 2075- 2078 seem to hold buyers at this time.
See today’s economic calendar with a rundown of releases.
THE RANGE OF TUESDAY’S MOTION
E-mini S&P 500 Futures (ES_F)
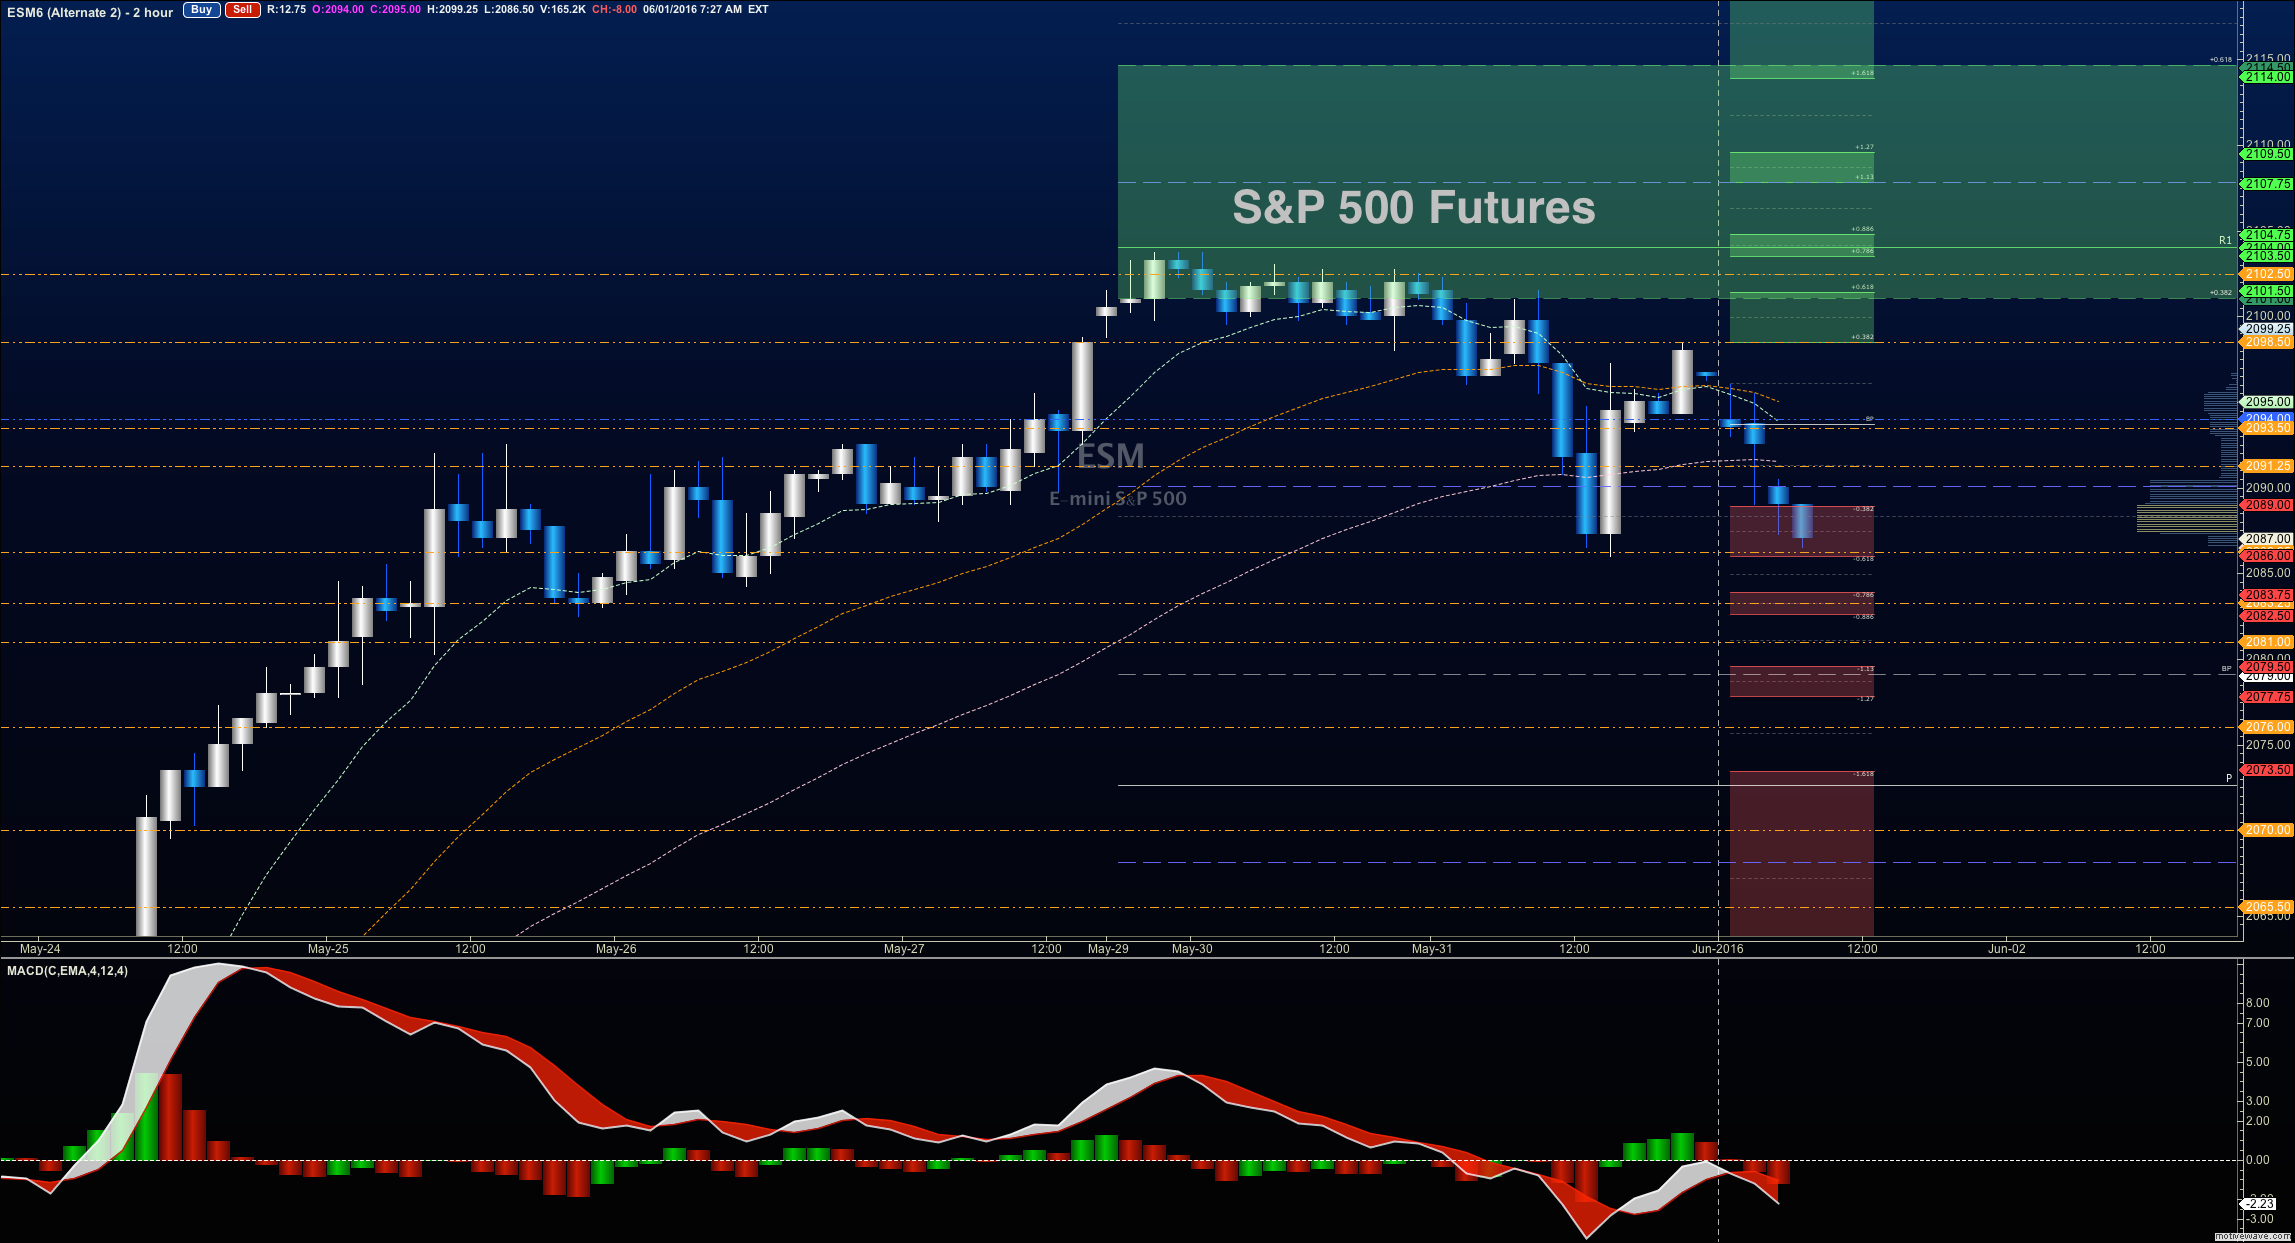
S&P 500 Futures Outlook for June 1, 2016 – Both momentum and trend are at reversal spaces at this time, with buyers and sellers squared off to compete at the current levels near 2087. We can see buyers coming in at 2081.5 below there. So the failed bounces off support into resistance make for the best setups at this writing.
Upside trades on S&P 500 futures – Favorable setups sit on the positive retest of 2089, or a positive retest of 2082.5 with positive momentum. I use the 30min to 1hr chart for the breach and retest mechanic. Targets from 2082.5 are 2086, 2088.25, 2092.5, 2095.5, 2098, 2099.75, and if perhaps 2101.25, 2103.75, and 2105.25 to 2107.5, if the shift of balance moves back to the buyers.
Downside trades on S&P 500 futures – Favorable setups sit below the failed retest of 2085.5 or at the failed retest of 2096.5 with negative divergence. It is important to watch for higher lows to develop with the 2096.5 entry, if the strength of returns to the buyers. Retracement into lower levels from 2096.5 gives us the targets 2094.25, 2092.5, 2089.5, 2086.75, 2085, 2078.5, and perhaps back to 2077.5 to 2075.
Have a look at the Fibonacci levels marked in the blog for more targets.
Nasdaq Futures
Nasdaq Futures Outlook for June 1, 2016 – The NQ_F holds quite range bound and is rejecting resistance. Bounces up into 4535- 4545 should be sold back into support. Deep support should bring buyers into the fray, but that could stretch wide and down into 4462 as thin volume prevails. Bearish action will be amplified below the failed retest of 4508, but the first pass down will find buyers into resistance.
Upside trades on Nasdaq Futures – Favorable setups sit on the positive retest of 4525, or a positive retest of 4502.5 with positive momentum. I use the 30min to 1hr chart for the breach and retest mechanic. Watch for the lower high to develop, and sellers to force the chart down, if sellers have taken hold below 4508. Targets from 4502.5 are 4505.5, 4508, 4513.5, 4518.25, 4525, 4528.25, 4536.5, 4544.75, 4550.75, and 4555.25. Range expansions above here should fail, but could stretch into 4580.
Downside trades on Nasdaq Futures – Favorable setups sit below the failed retest of 4495.5 or at the failed retest of 4508 with negative divergence. Retracement into lower levels from 4508 gives us the targets 4502.5, 4497.5, 4479.5, 4472.25, 4464.75, 4451.25, and perhaps 4434.5.
Oil
Outlook for Jun 1, 2016 -CL_F –The swift moves up in oil provide weak and thin volume profiles that allow the collapse of price. Exaggerated by this is the OPEC meeting knowing that the Saudis are not keen on oil rising above 50/pb. Key things to remember when trading oil, as with other instruments, there are certain price tests that shift the balance and behavior of traders in the chart.
Trading range suggests support action near 47.24, and resistance behavior near 49.24.
Upside trades can be staged on the positive retest of 48.86, or after a dip into 48.14, but carefully watch for a failure to hold the range near 48.43, if the deep support is taken long. I often use the 30min to 1hr chart for the breach and retest mechanic. Targets from 48.14 are 48.41, 48.82, 49.02, 49.14, 49.32, 49.57, 49.74, 49.97, and 50.04.
Downside trades can be staged on the failed retest of 48.74, or at the failed retest of 49.07 with negative divergence. These setups give us targets from 49.07 into 48.86, 48.74, 48.49, 48.27, 47.97, and perhaps 47.68 to 47.24.
If you’re interested in the live trading room, it is now primarily stock market futures content, though we do track heavily traded stocks and their likely daily trajectories as well – we begin at 9am with a morning report and likely chart movements along with trade setups for the day.
As long as the trader keeps himself aware of support and resistance levels, risk can be very adequately managed to play in either direction as bottom picking remains a behavior pattern that is developing with value buyers and speculative traders.
Twitter: @AnneMarieTrades
The author trades stock market futures every day and may have a position in mentioned securities at the time of publication. Any opinions expressed herein are solely those of the author, and do not in any way represent the views or opinions of any other person or entity.

")


 Rolling Over At Key Fibonacci Level?")
