Choppy trading in stock market futures marked Monday’s moves – with charts resting above resistance only to fade quickly overnight. News out of Europe and the East are weighing on the charts.
The Morning Report: Futures Fade Lower; Test Key Support Area
Support levels yesterday are now resistance for stock market futures. Looking at the price action on the S&P 500 futures, the region between 1917-1923 is key resistance area for now – with a likely stretch to 1923 that could still give way to selling as we see negative divergence.
Longer time frame resistance levels on the S&P 500 futures are sitting now at 1928, 1934, 1939.5 and 1942 -1948 (that still is a messy congestion patch).
Primary intraday resistance sits near 1934.5- as it was yesterday. It breached this level yesterday but gave it up rather quickly to sellers. Key intraday support for S&P 500 futures sits at 1909 – congestion sits between 1914 and 1918– watch this region – they will gives clues to moves ahead. Deeper pullbacks should continue to be bought-expecting to see higher lows, and expansions upward may likely be sold at higher highs – we sit in jagged ranges, while still looking for higher lows to continue across stock market futures.
Shorter time frame momentum indicators are sitting in neutral to positive territory. Longer cycles are downward trending but lifting – this means larger upside resistance tests should be sold, but deeper pullbacks will bring value buyers into the fray.
See today’s economic calendar with a rundown of releases.
THE RANGE OF TUESDAY’S MOTION
Crude Oil Futures (CL_F)
Crude Oil futures gave back all of its upward gains from days past into support this morning. The chart is stalled near 30.5 but should begin a bounce soon into resistance.
Today, the trading ranges are between 30.16 and 31.78, with 30.85-31.3 being an important congestion zone. Failure to breach this 30.9 region suggests that momentum brings us near the test of 30.
Moving averages in crude oil are mixed across time frames – bigger averages suggest selling bounces while faster averages suggest buying off support. This gives rise to jagged price action. Deeper pullbacks are still very likely to be bought as the chart continues to base.
Intraday long trade setups suggest a long off 30.9 retest (but not before) or 30.55 (with momentum showing positive, else that brings a lower high) into 30.85, 31.04, 31.29, 31.43, 31.62, and perhaps 31.9 if range expands
Intraday short trade setups suggest a short below a 30.8 failed retest or a failed retest of 31.29 with negative divergence showing sends us to 31.04, 30.9, 30.7, 30.55, 30.35, 30.16, and perhaps 29.96.
E-mini S&P 500 Futures (ES_F)
Below is a S&P 500 futures chart with price support and resistance trading levels for today. Click to enlarge.
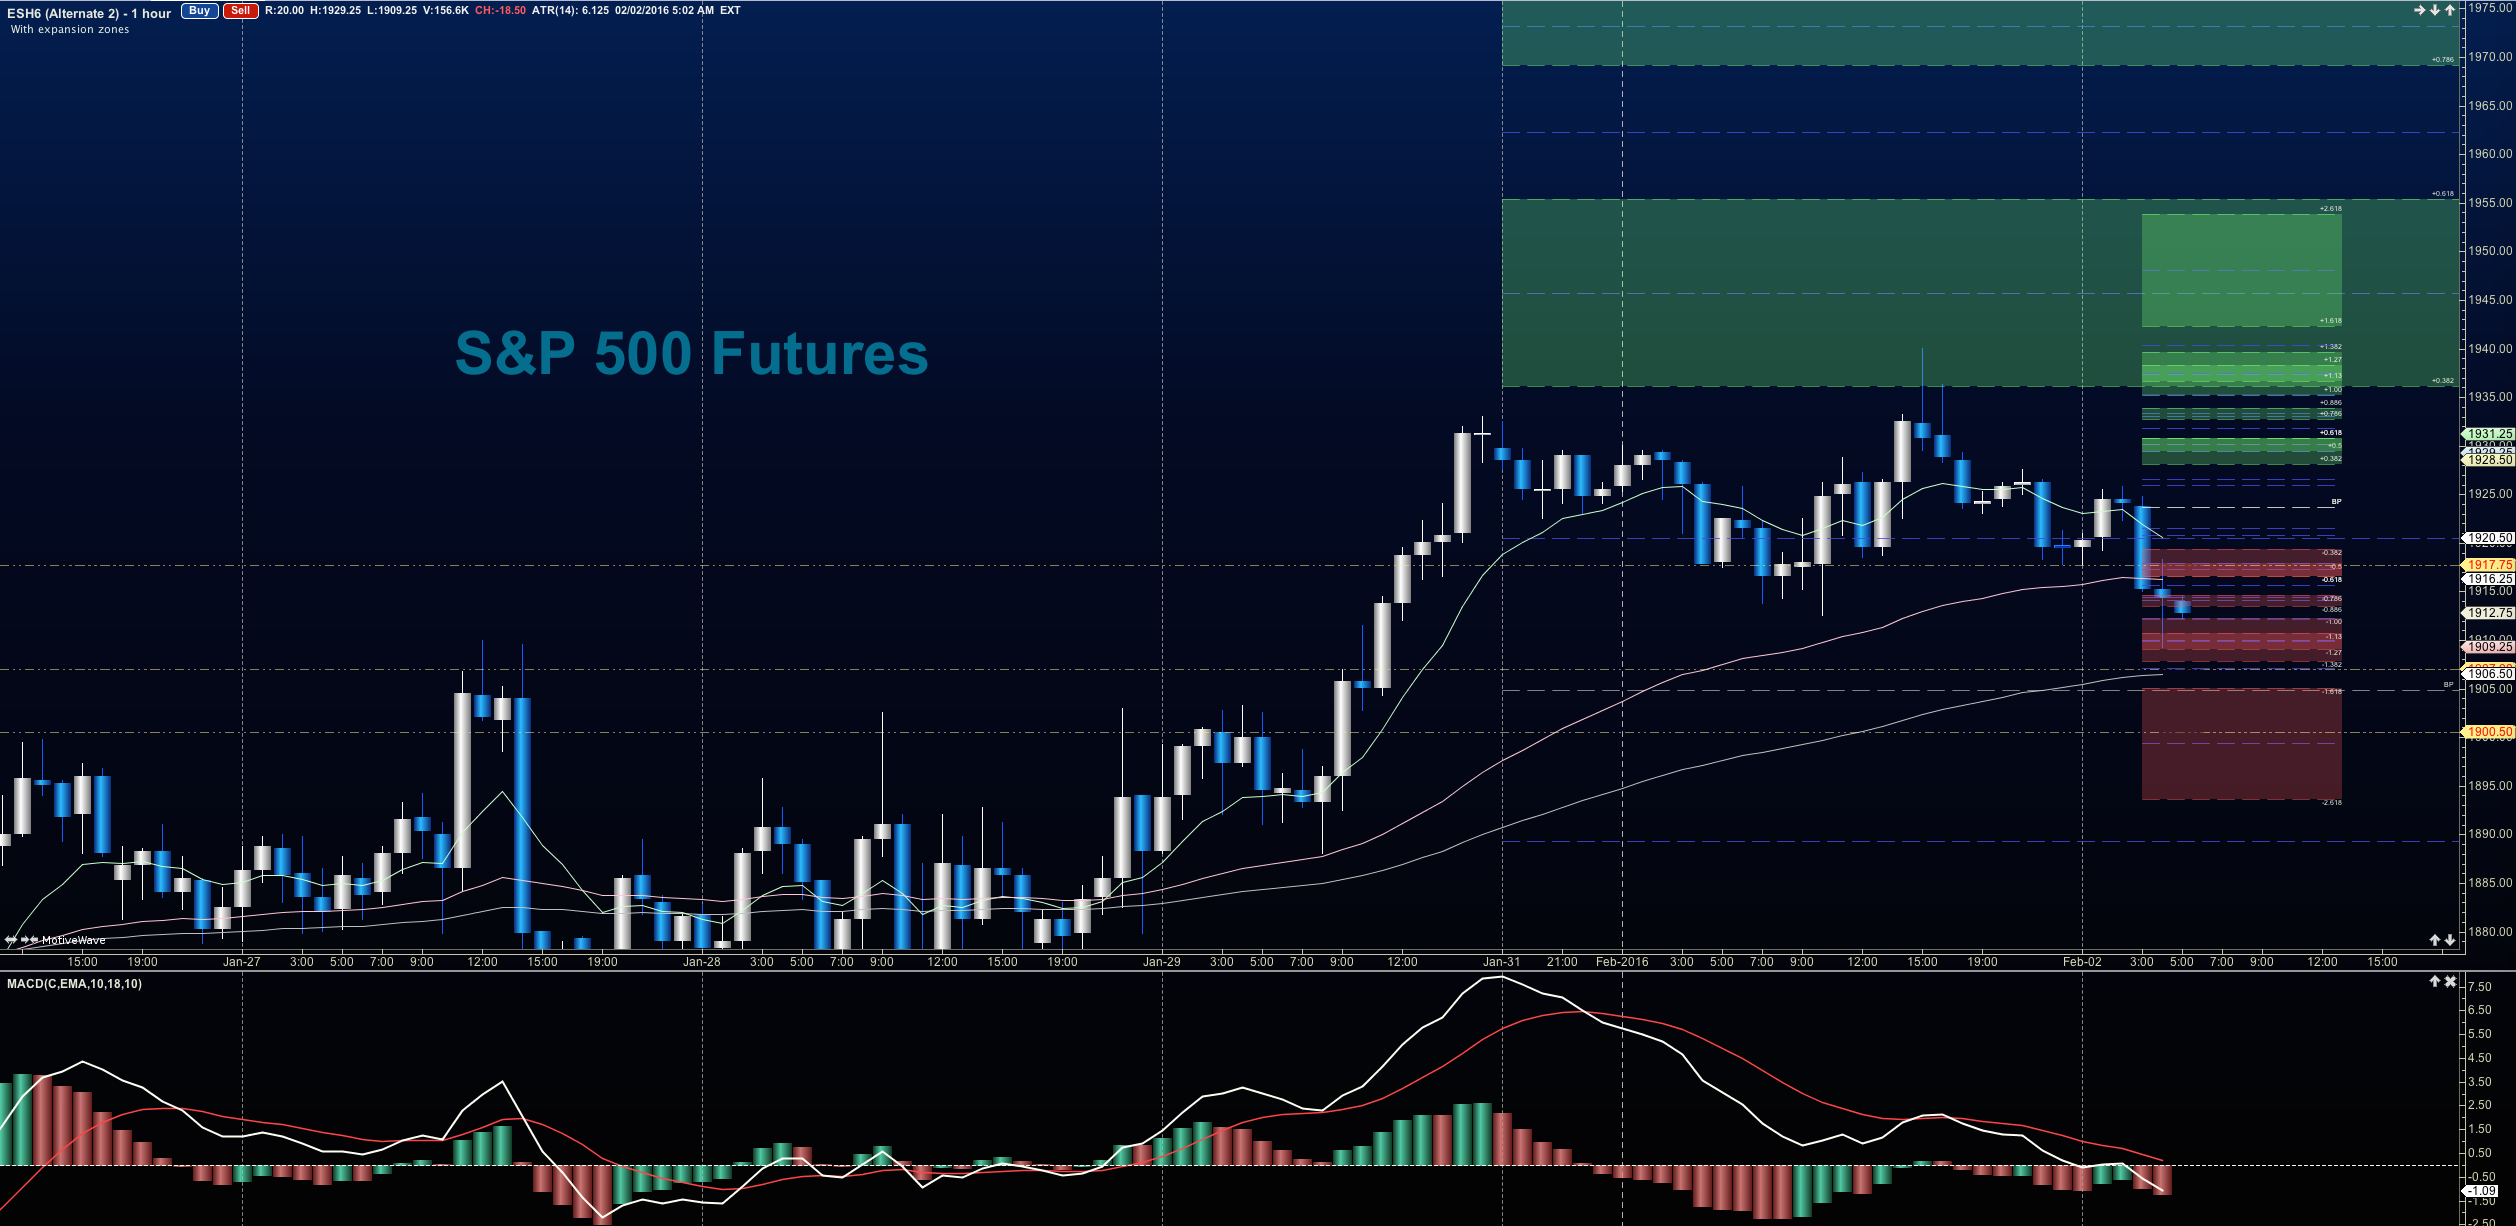
The S&P 500 futures chart is holding steady near breakout levels. A region of important support to maintain remains near 1917-1923. The bulls would like to retake this level.
Upside motion has the best setup on the breach of and positive retest of 1919.5 – or a retest after expansion above 1929. We could also consider the breakout above 1925 but be ready to take profit as it expands into 1929 at the first pass. Targets from 1919 are 1921.5, 1925, 1928.5, 1932.25, 1934.25, 1939.75, and 1942.5. Big resistance test sits at the region between 1927.75 -1929.5. The chart could expand under positive strength into 1947.75-1949 and higher if momentum lifts. Be careful- watch the higher lows to keep you on the right side of the trade.
Downside motion opens below the failed retest of 1910.5 or at the failure to hold 1932.25 bounce. Retracement into lower levels from 1915.5 gives us the targets at 1911.5, 1907.75, 1904.75, and perhaps 1902.25.
If you’re interested in the live trading room, it is now primarily stock market futures content, though we do track heavily traded stocks and their likely daily trajectories as well – we begin at 9am with a morning report and likely chart movements along with trade setups for the day.
As long as traders remain aware of support and resistance levels, risk can be very adequately managed to play in either direction as bottom picking remains a behavior pattern that is developing with value buyers and speculative traders.
Twitter: @AnneMarieTrades
The author trades stock market futures every day and may have a position in mentioned securities at the time of publication. Any opinions expressed herein are solely those of the author, and do not in any way represent the views or opinions of any other person or entity.

 Rolling Over At Key Fibonacci Level?")


