The U.S. stock market indices had a powerful session on Tuesday, followed by another good session on Wednesday. Volume could have been a little better on major U.S. indices but price spoke loud and clear… and this may benefit stock market bulls over the near-term.
The Nasdaq 100 surged 2.1 percent on Tuesday, the Russell 2000 small cap index 2.2 percent, the S&P 500 large cap index 1.4 percent, and the Dow Industrials 1.2 percent, among others. Of the four, the Nasdaq and the Russell 2000 retook both 50- and 200-day moving averages at one go, the S&P 500 recaptured its 50-day, while the Dow closed right on its 50-day. The latter two were already both above their respective 200-day.
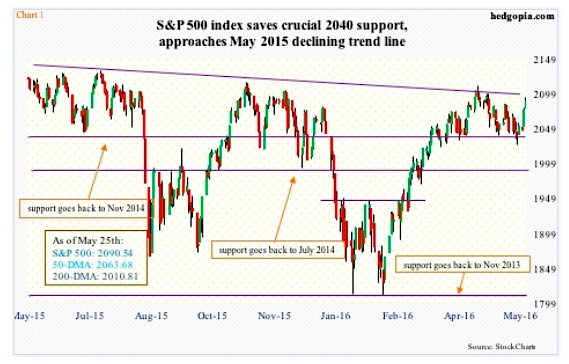
Before Tuesday, these indices all successfully defended important support – 2040 on the S&P 500 (Chart 1), 4270-4350 on the Nasdaq 100, 1090-1120 on the Russell 2000, and 17200-17300 on the Dow. This was an important development for market bulls.
How important could Tuesday’s action be? Potentially important near-term, but less so medium-term. Here is why.
There are mixed signals coming from the options market.
It is important to remember that February 11th lows in U.S. equities were significant. Major indices all have had massive rallies since then. So using these lows as a reference point for comparative purposes is probably not a bad idea.
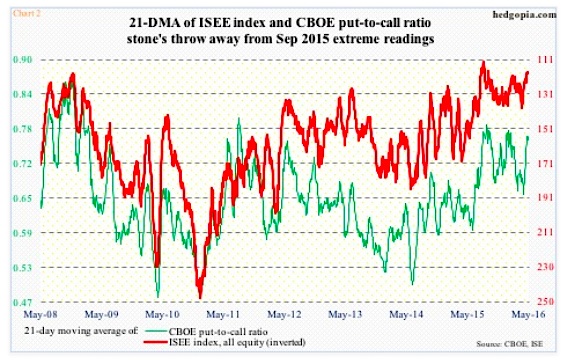
Back then, the 21-day moving average of the CBOE put-to-call ratio stood at 0.76 and the ISE index at 122.3; the former had peaked three sessions ago at 0.771 and the latter bottomed two sessions later at 120.4. Current readings – 0.763 and 118.8, respectively – are at comparable levels. These are highly elevated readings, and in the right circumstances, can act as a big tailwind for stocks and market bulls (Chart 2).
A big help back then also came from oversold technicals – particularly on a weekly basis. As well, monthly momentum indicators were itching to turn up from the median, and they did. Now, weekly indicators in particular are in overbought territory.
Also back then, short interest helped.
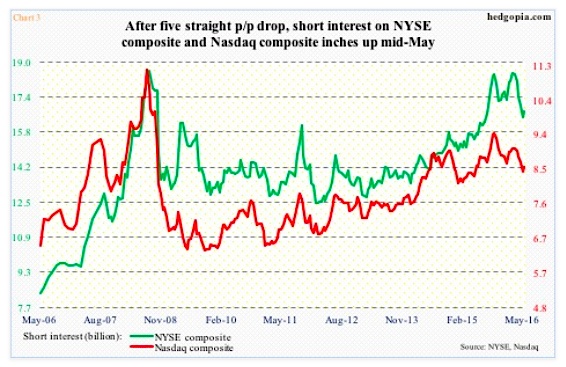
Three months ago, short interest stood at 18.5 billion on the NYSE composite and 9.1 billion on the Nasdaq composite; in the next five periods, it dropped 11.2 percent and seven percent, in that order. The resultant squeeze was a big boost for stocks.
Fast forward to mid-May, short interest had dropped to 16.7 billion on the NYSE and 8.6 billion on the Nasdaq. From a longer-term perspective, these are still elevated levels, but when compared to the February 12th period the potential fuel for squeeze does not look as potent.
Last but not the least is the volatility curve. Once again, the Tuesday rally was powerful. There is no other way to put it. The magnitude of the rally crushed near-term volatility, even as longer-term premium held up. In other words, the VXST (nine days)-VIX (30 days)-VXV (three months)-VXMT (six months) curve got quite steep on Tuesday as well as on Wednesday (Chart 4).
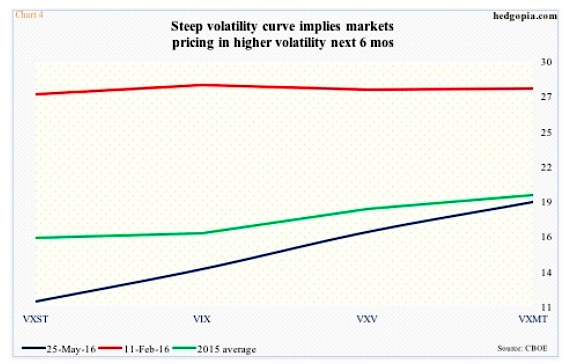
Unlike February 11th, which was in backwardation, the curve is in contango, suggesting markets are bracing for higher volatility in the next six months. This was the opposite of what the curve was implying on February 11th.
Stocks’ near-term path of least resistance may be up, but probably rocky medium-term.
Thanks for reading!
Twitter: @hedgopia
Read more from Paban on his blog.
Author may hold a position in mentioned securities at the time of publication. Any opinions expressed herein are solely those of the author, and do not in any way represent the views or opinions of any other person or entity.


