While the state of the union may have been addressed in January, as we approach the end of the 1st quarter if trading in 2015, I want to take some time to craft a four part series reflecting on each of the major stock market indices. This isn’t necessarily to lay out a forecast for exactly what’s going to happen next. And since the major opportunity to go long presented itself weeks ago, the question now is what to do and how to manage positions as the market taps the highs on all four stock market indices.
After correcting in October and rebounding into year end, investors have been navigating choppy waters for the past several months. The first potential opportunity that appeared to lift the market in 2015 quickly turned down before resetting itself once again for the run higher we’ve seen over the past few weeks.
As seen below, the overall market picture has lifted to all time highs but low volume persists. Can we go higher on low volume? It’s certainly possible, as markets have done this repeatedly. But we are definitely at an important crossroads. Let’s examine some key charts and the paint a picture of the current state of the e-mini Russell 2000 futures (TF) and what roadblocks are ahead and what support lies below.
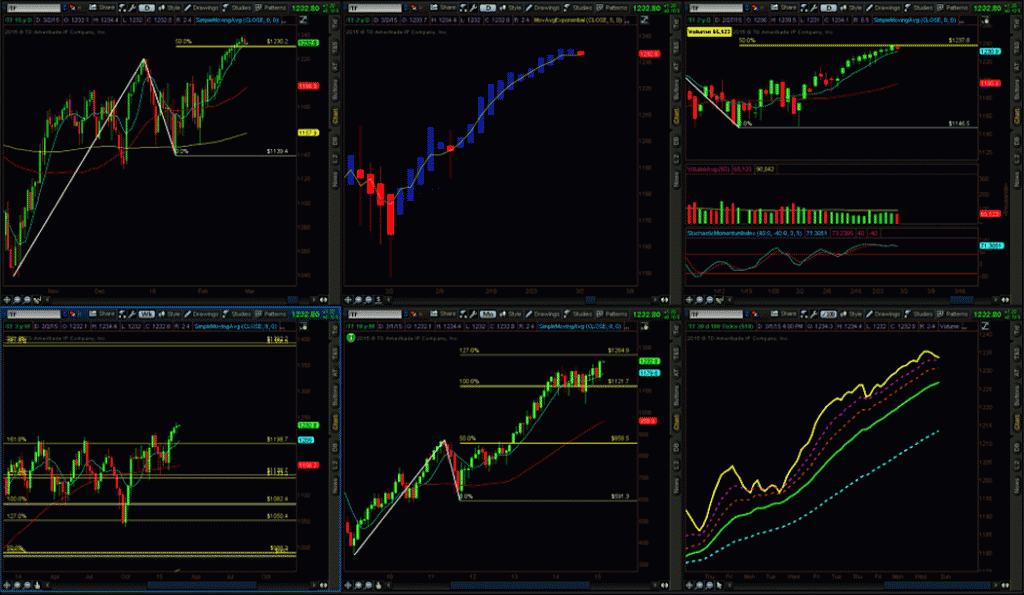
RUSSELL 2000 E-mini Technical Analysis Screen Grid
Top row (L to R): Daily chart (24hr), Daily Heikin Ashi with a 5/34 EMA, Daily Chart (US hours only)
Bottom Row (L to R): Weekly Chart, Monthly Chart, EMA (No Bars) 5, 13, 21,34,80
Now let’s dig in to the various time frames and indicators to see what’s happening. Below is a daily chart of the Russell 2000 futures (TF).
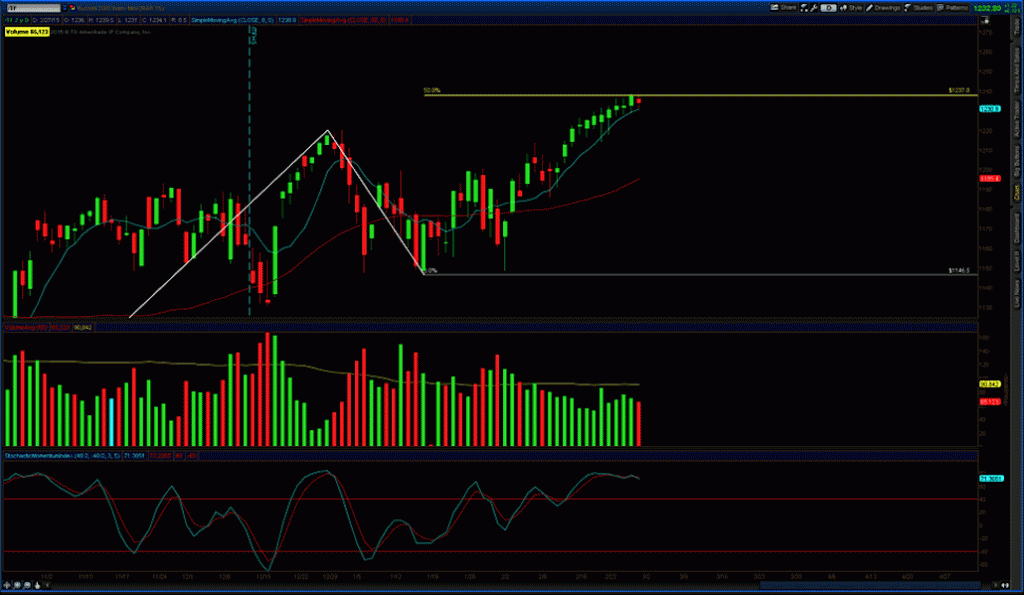
Russell 2000 E-Mini Futures (TF) Daily Chart – US Trading Hours Only
This chart include an 8 and 50sma. The price action here can be seen hitting the Fibonacci target #1… which was an 85 percent probability from the entry after price action closed above the 8sma on 1/21/15 with a stop at 1146.5 (that was never hit). That’s a tremendous trade for any swing trader. With price action now at fib target #1, a trader could take gains on this hypothetical trade and move their stop up to break-even, pocketing gains and staying in the trade.
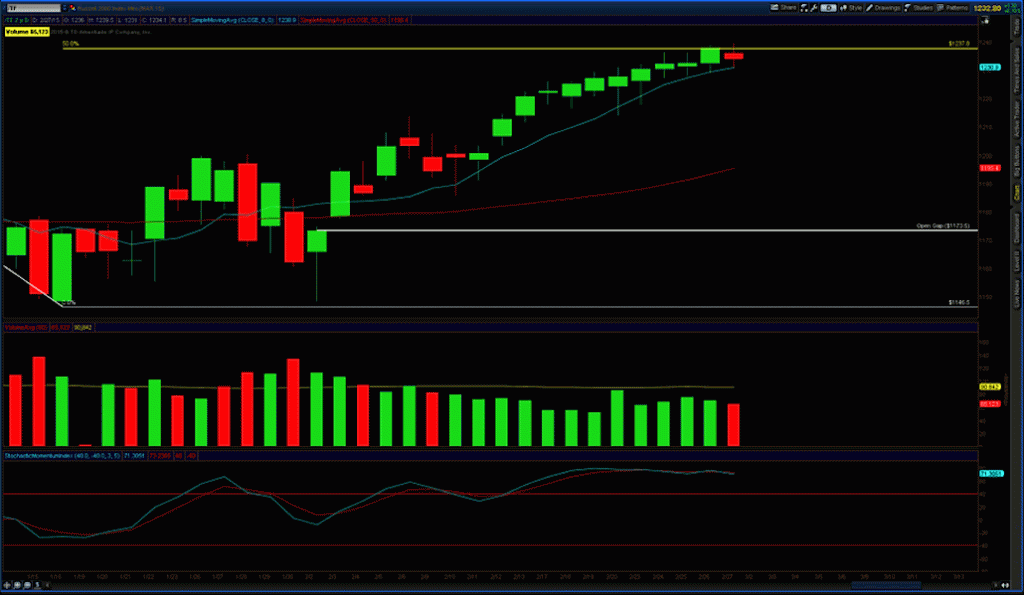
Any concerns that price action may come back down? Perhaps the fact that volume that has gotten us up to this level and 1 day fade on lower than normal volume can bring us back down. Price and momentum are waning and could be the start of a down move or slight correction. Momentum is something that can turn back up, but I’m more concerned with is the open gap that sits below at 1173.5. See the chart below.
Russell 2000 E-Mini Futures (TF) Daily Chart – US trading hours – Open Gap @ 1173.5
Does this mean that before we go higher we need to close the gap? Nothing says that this needs to occur now but eventually all gaps get closed. With low volume on the price increase, any weakness makes a good case to go close the gap prior to going any higher.
Now let’s zoom out to the monthly chart and get some macro perspective.
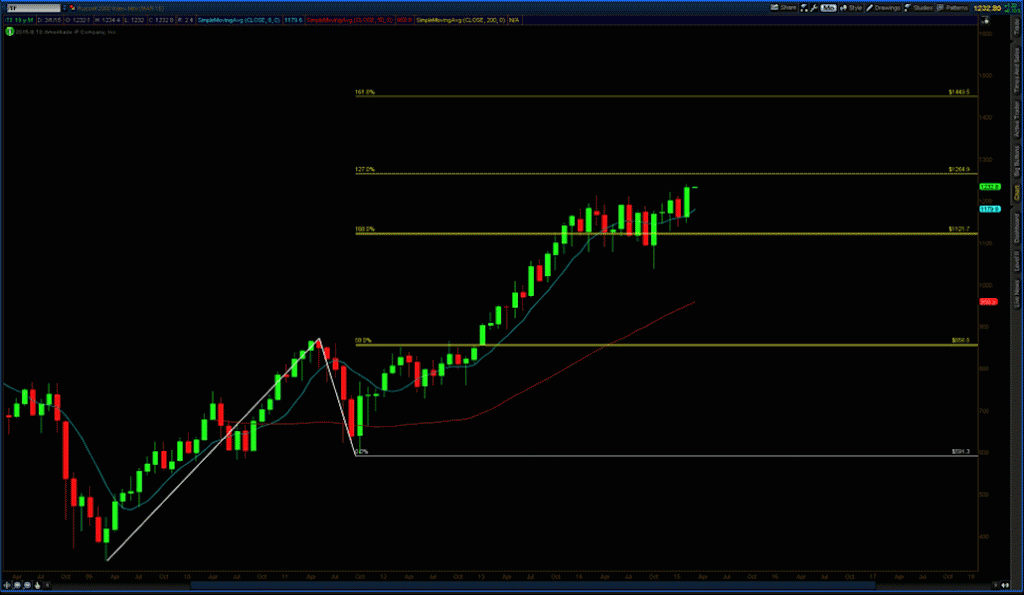
Russell 2000 Futures (TF) Monthly Chart – Fibonacci Targets – 8/50/200SMA
Taking a look at the monthly chart, you can see the target above at 1264.9. If we would have entered based on the system I follow (back in October of 2011) a trader would have achieved one Fibonacci target after another with the same trade management tools of a weekly or daily chart to keep them in the trade. With the monthly chart supporting the continued gains in the daily charts, a move of 300 stocks to the upside is viable.
Fibonacci targets and levels are all good for management of the trade, but the strongest indicator that this drive is in trend lies in the Heikin Ashi bars and Moving averages.
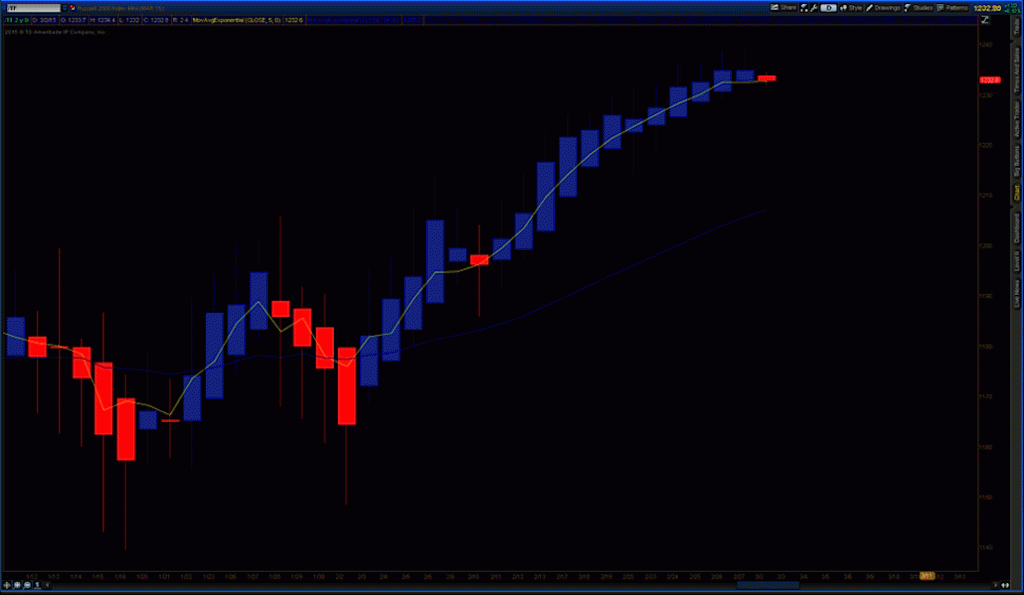
Russell 2000 E-Mini Futures Daily Chart – 24 hours – Heikin Ashi – 5/34 EMA
Heikin Ashi bars, an indicator that trend is in play, can be seen here on a daily crossover that setup on 2/3/15 and has remained in trend ever since. With the evidence on the daily chart of hitting the Fibonacci target, HA bars can be seen here still in trend to the upside with hesitation at the top as indecision candles have formed. What would keep you in the trade to the Fibonacci target? Simply observing the daily bars as they remain in trend.
To support the HA bars, the second preferred indicator to show that price action remains upside are the moving averages.
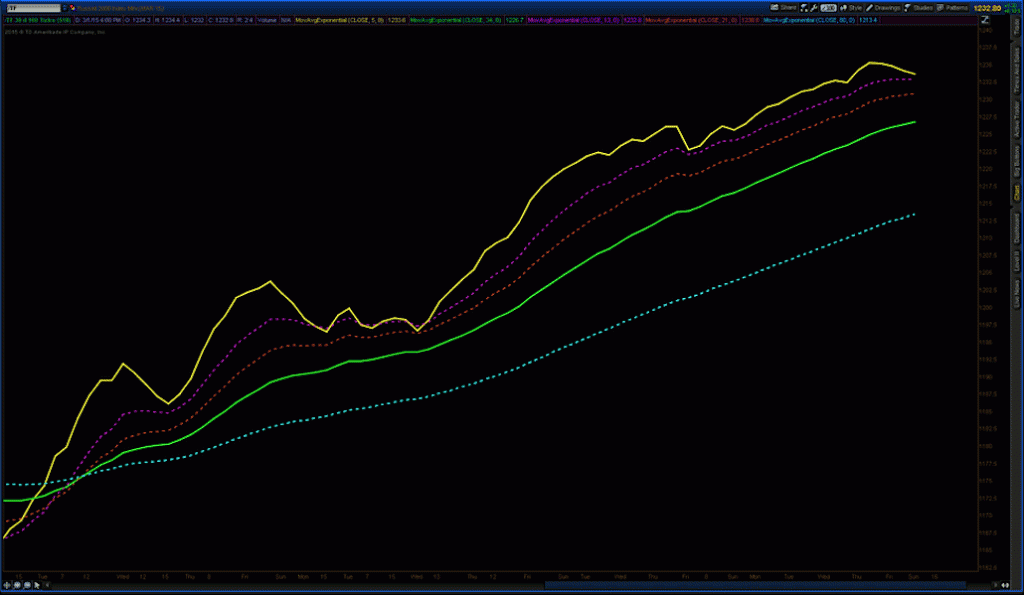
100 Tick Range Chart – 5/13/21/34/80EMA – Bars Removed
As seen here above, the longer term trend has given opportunity for re-entry on pullback if the 5 to the 13 or 21 ema as price action continues upside. With the 5 ema now juxtaposed to the 13 off of price action continues upside re-entry above the fib target with the moving averages to keep you in trend. Clearly the evidence of the moving averages on a 100 tick range chart continue to remain upside. Sure the HA bars pause is of some concern, but I don’t see any reason as of yet to see the trend reversing.
So where does this leave the intraday and long term trader for the highest probability trade?
On an intraday basis, the trade to the long side would be triggered by a combination of Fibonacci setups in conjunction with moving average crossovers. And it would be strengthened once the price action cleared fib target #1 at 1237.8. Best supporting move will be on a Heikin Ashi bar that has a solid body and tail up configurment.
From a longer term view, price action breaking above 1237.8 and closing above on a daily chart, and support of the 5 ema chart, may just move the TF up to the next monthly fib target at 1264.9.
I also want to reiterate the two facts that may prevent price action from moving higher at this point; an open gap below and low volume that has pushed price to fib target #1. We are also nearing the end of the first quarter contract which can add some volatility into the market.
While I may not have the crystal ball to know what lies ahead, knowing the big picture allows me the opportunity to take intraday trades on a higher probability with the direction of the trend. Note that I personally trade the TF on an intraday basis, in and out. So I don’t hold long term. My next article will look at the state of the e-mini Dow futures (YM). Thanks for reading.
Follow David on Twitter: @TradingFibz
The author has no positions in any of the mentioned securities at the time of publication. Any opinions expressed herein are solely those of the author, and do not in any way represent the views or opinions of any other person or entity.

