As a technical trader, I leave the fundamentals to the experts. This is why I enjoy the IBD for solid research – I can pair it with my technical setups for proper timing on entries. Fundamentally speaking, as per IBD groupings, Starbucks stock (SBUX) comes in at #1 in its group (Retail-Restaurant).
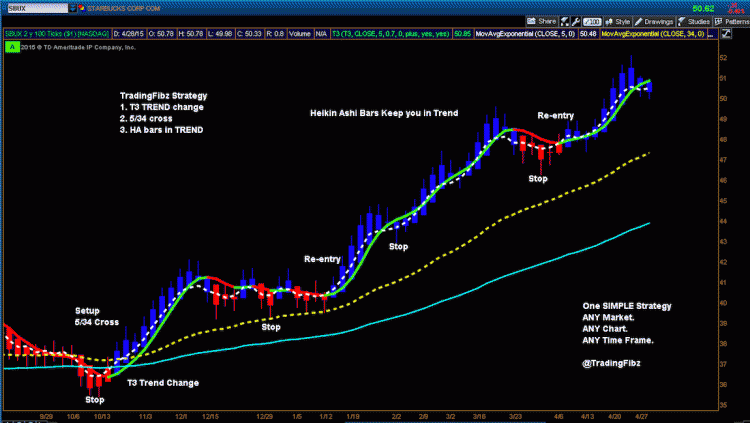
Okay, let’s look at the technical setup on the chart and see what the stock price is saying. The chart below dates back to the initial setup in late October, 2014 (100 tick chart).
Now let’s look at my check list of fundamental and technical happenings.
- Starbucks stock is fundamentally strong in value as per IBD ranking.
- The technical setup on SBUX continues to remain strong to the upside; per Heikin Ashi/Moving Average combo.
- Looking for entry? Wait for the 5ema to cross the T3 Moving Average and Heikin Ashi bar with a solid body/wick up.
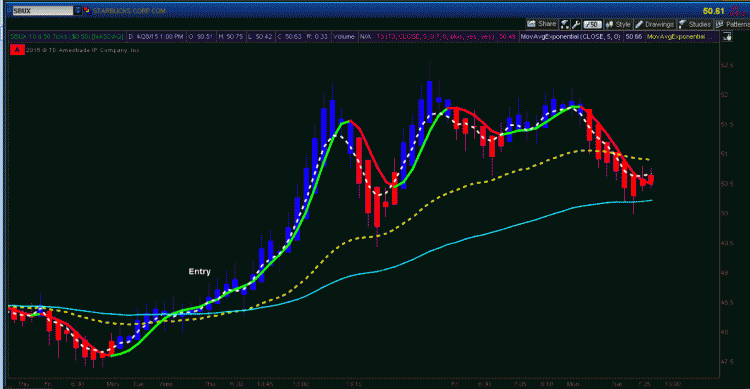
- For better timing, look to the intraday chart with a shorter time frame (50 tick) and same setup as on the 100 tick range chart.
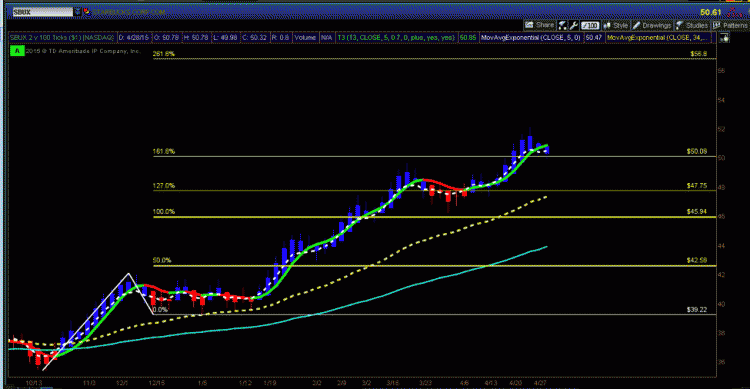
- Fibonacci targets continue to be reached, with 56.80 outstanding as the upper target.
- Looking to remain in SBUX for the long term? Use the 3Sig technique by Jason Kelly to review your investments per quarter (Value based and rebalancing on 3% continued growth).
Follow David on Twitter: @TradingFibz
The author has no positions in any of the mentioned securities at the time of publication. Any opinions expressed herein are solely those of the author, and do not in any way represent the views or opinions of any other person or entity.


