The SPDR S&P 500 ETF Trust (SPY) installed it’s 3rd consecutive daily close above it’s upper Bollinger Band (20,2) with Thursday’s low-volume drift further into the ether of new all-time highs.
Over the last 10 years, this technical event has occurred just 9 times. Despite the rarity of it’s extended bullish orientation and possessing the indelible aura of a market getting ahead of itself in the short-term, this is by no means an unqualified short signal.
But, that doesn’t mean the material for a well-executed trade setup isn’t here.
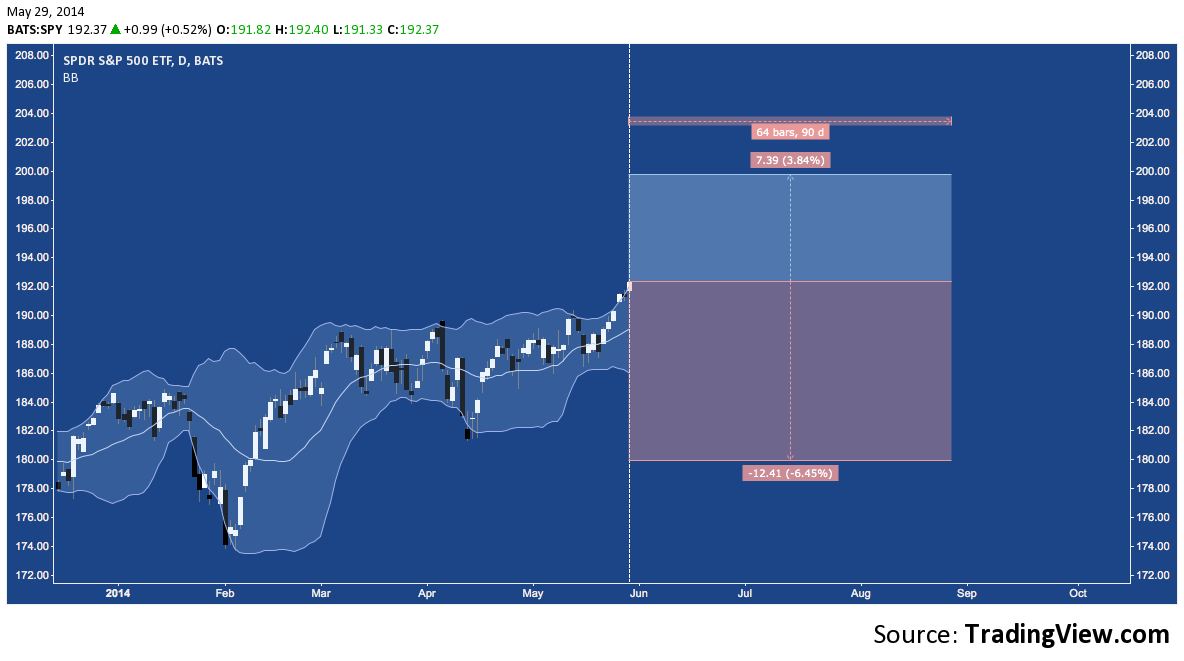
Looking back over these nine historic occurrences, assume a short position is opened on the third consecutive daily close above the upper Bollinger Band with a 90-calendar day trade horizon. The following stats result:
- Win ratio: 5/9 (55.6%). SPY wasn’t necessarily lower or higher at the end of the 90 period, but did sell off more deeply than it rallied the majority of the time.
- Risk — average distance to peak: 3.84%. This is the average adverse incursion (the worst the market went against the position) across all nine occurrences. The worst (by a solid margin) was 9.99%, which occurred during July 2009’s 15% meltup.
- Reward — average distance to trough: 6.45%. This is the average selloff that occurred over the period. Here, the best was the 19.81% drop (even more concise and potent than July 2009’s rally) in July-August 2011.
- R-Multiple: 1.68. Across the series, the ratio of reward-to-risk measures 1.68-to-1.
While past performance is no guarantee of future results, mapping these averages over today’s close gives us the following scenario to look forward to between now and Labor Day:
2014:
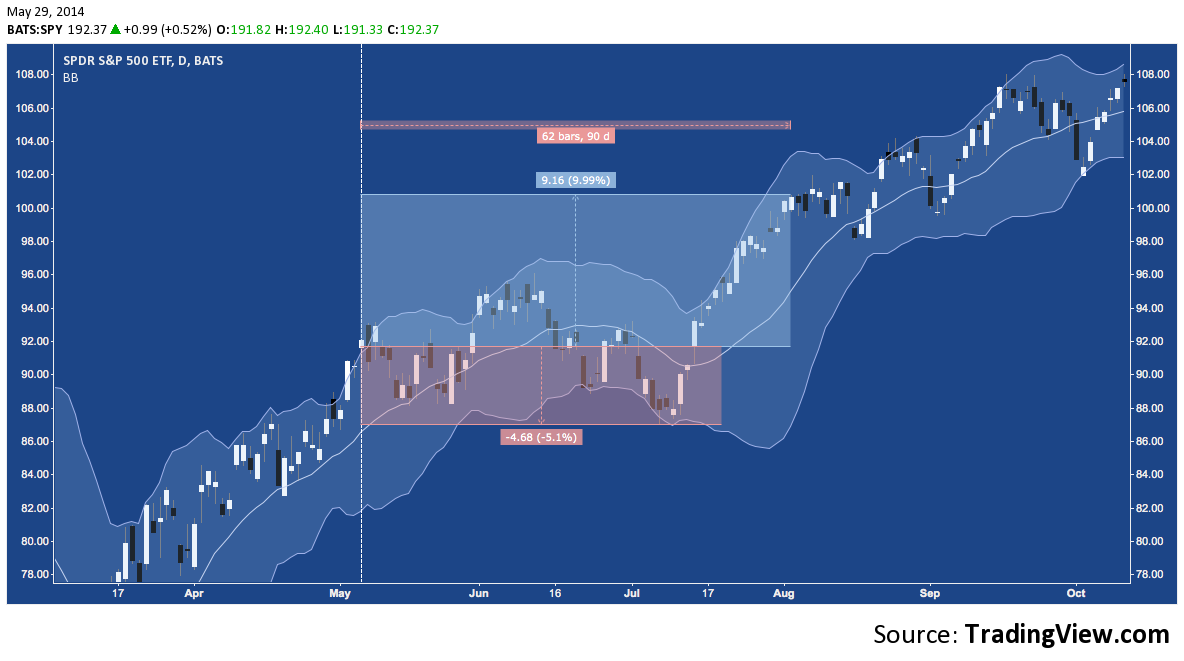
Here’s a lookback at how each of the previous occurrences unfolded. A couple of significant features: 1) in most cases, a congestion period last roughly a month follows the occurrence before a more definite directional move then emerges; and 2) in the majority of occurrences, major secondary trends (e.g. the -12% decline in Summer 2007) begin just as the 3-month time horizon studied is ending or has ended.
Between these two points, the technical event of “3 consecutive daily closes above the upper Bollinger band” signals heightened volatility ahead, especially in the 30-90 day period following it. Yet another study suggesting the summer may be anything but dull.
2004-2006:
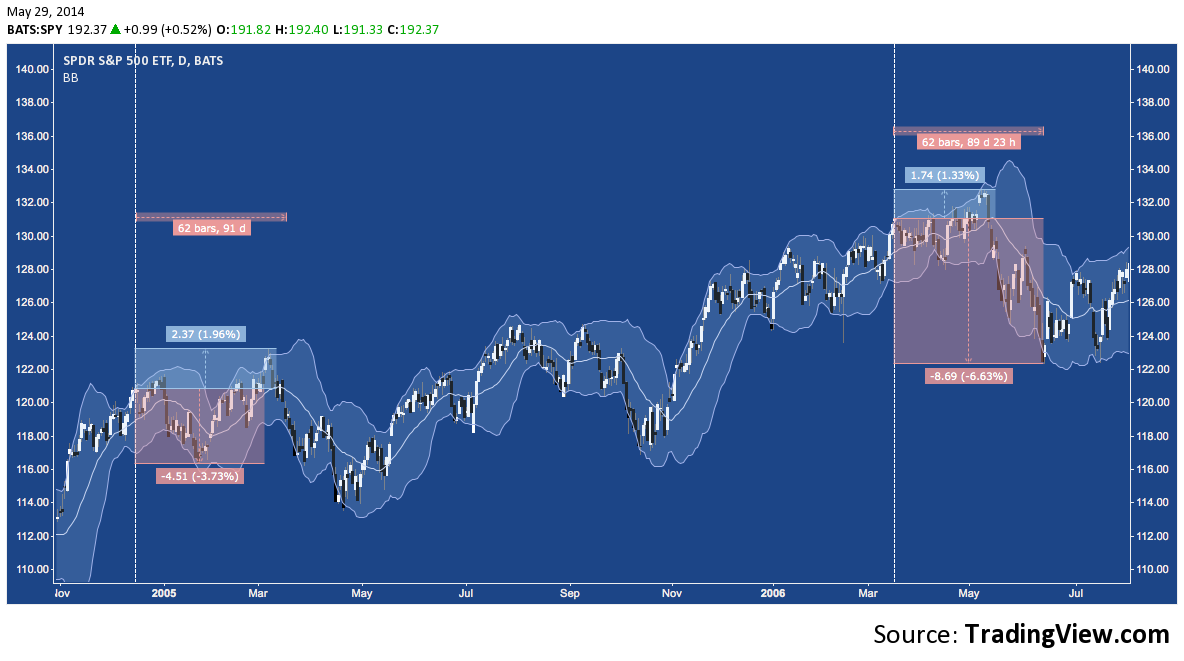
2006-2007:
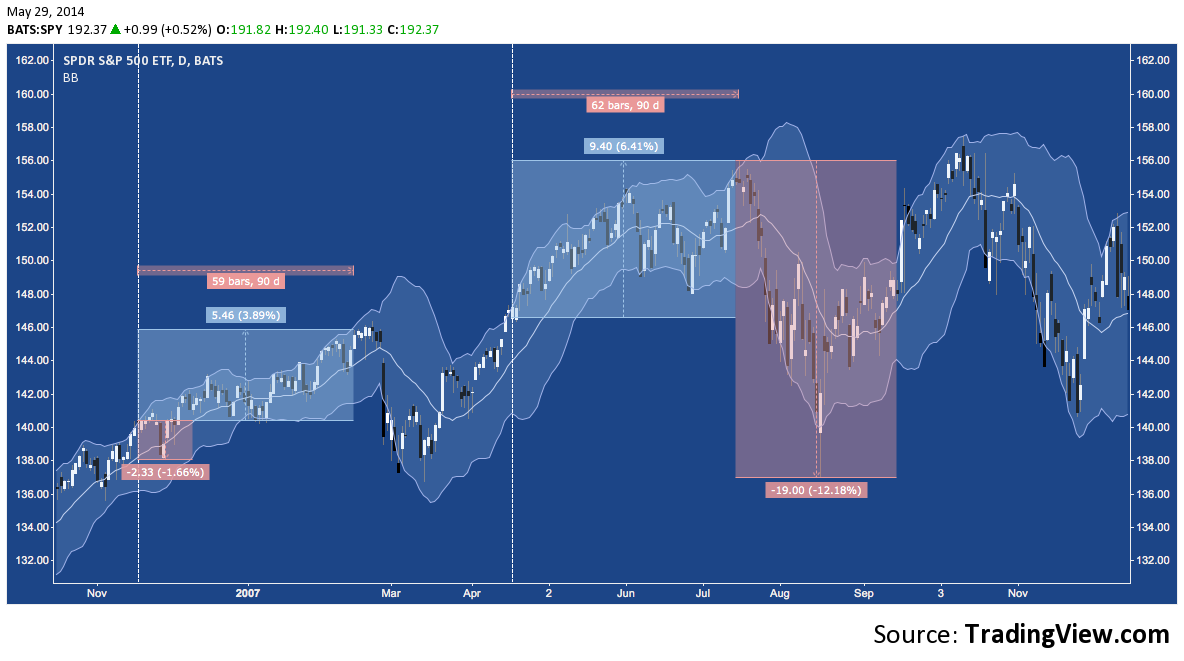
2009:
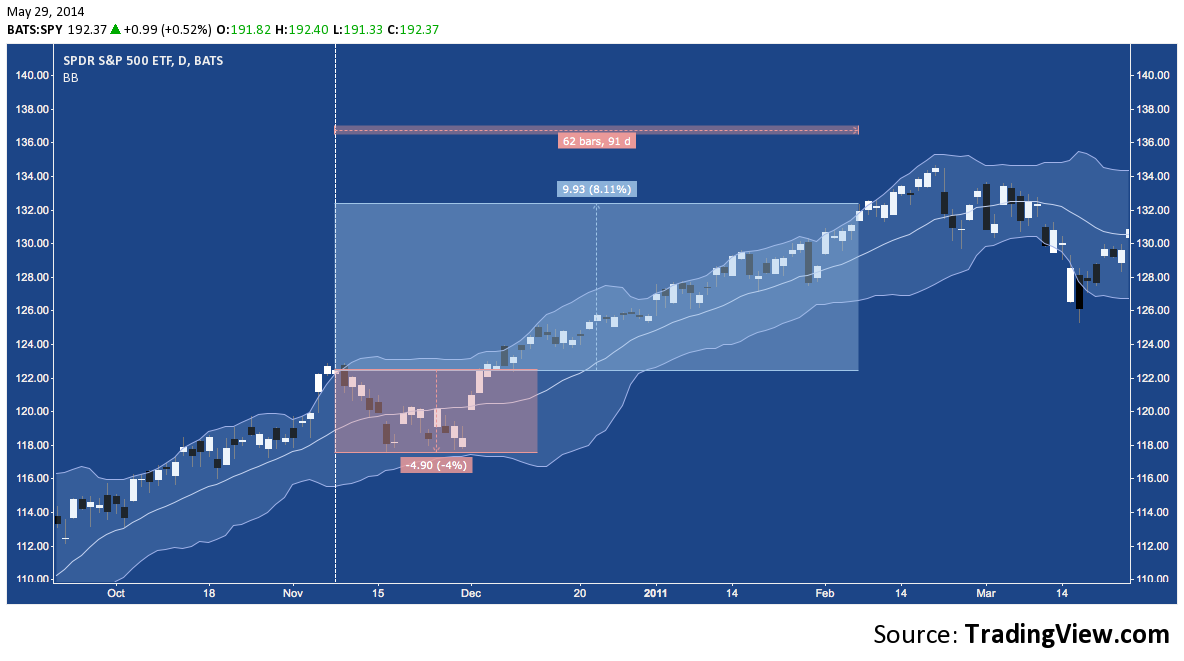
2010-2011:
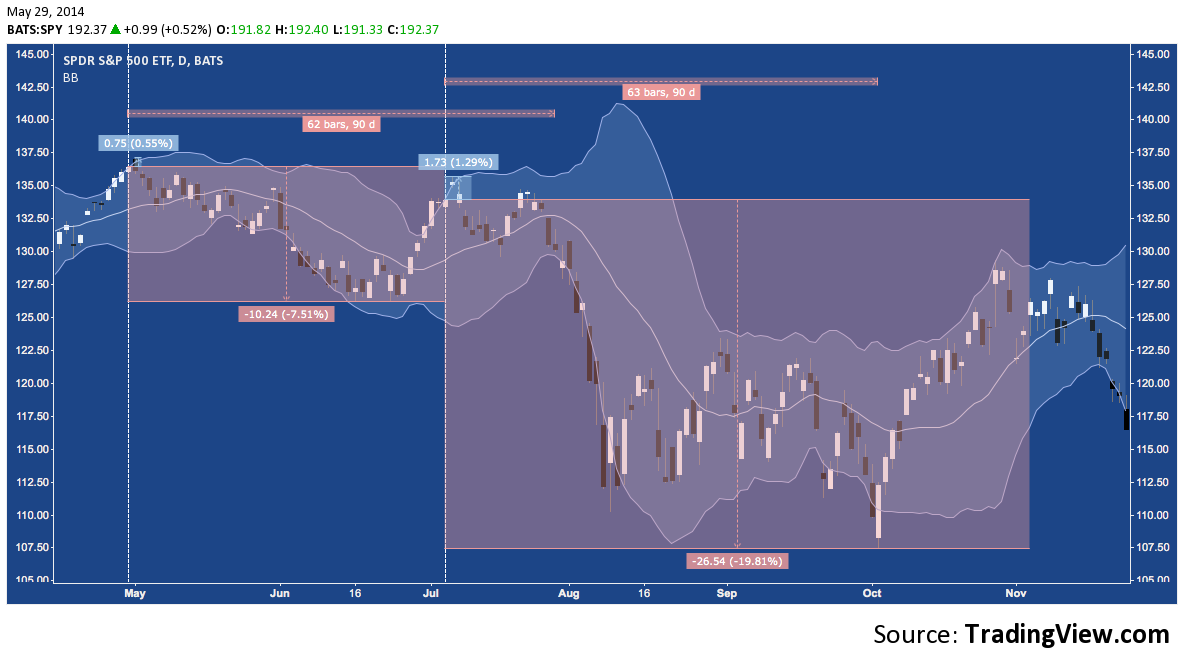
2011:
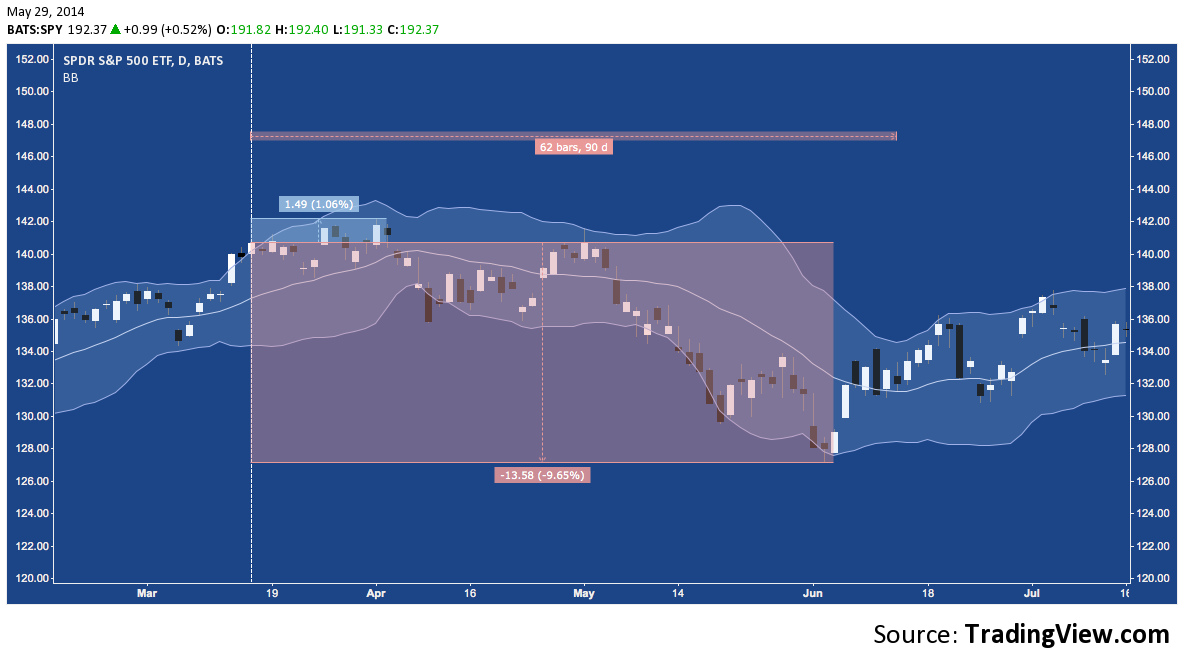
2012:
Twitter: @andrewunknown and @seeitmarket
Author holds no exposure to securities mentioned at the time of publication. Commentary provided is for educational purposes only and in no way constitutes trading or investment advice.
Any opinions expressed herein are solely those of the author, and do not in any way represent the views or opinions of any other person or entity.


")


 Rolling Over At Key Fibonacci Level?")
