With the (very) old bull market in the U.S. equities about to complete its seventh year, there is rampant speculation regarding when and how its inevitable end will arrive.
As is always the case with bull market tops or major turning points, they frustrate all attempts at prediction.
Fundamental analysts have been warning about lackluster earnings and historically high price-to-earnings ratios for some time now, yet the bull grinds on.
Traditional technical analysts have not had better luck either as every price correction has lead to yet another push to new all-time highs.
Intermarket analysis may offer a more reliable and timely way to identify the turning point in the U.S. equities.
What is Intermarket Analysis?
For those of you who may not be familiar with intermarket analysis, it is a field of study rooted in interpreting price action and is therefore a branch of technical analysis.
Unlike traditional technical analysis with its single market focus, intermarket analysis studies the interplay between global macro asset classes.
According to John Murphy, who is considered the father of this field:
“the basic premise of intermarket analysis is that all markets are related.”
Translation: What happens in equity markets will always be influenced by what goes on in the commodity, bond, or currency markets and vice versa.
Murphy’s body of work goes into great detail analyzing the countless linkages among the global financial markets and it is hard to imagine any professional market analyst not familiar with his work.
For the purposes of this article I will ignore all currency markets and focus on just two major intermarket analysis principles:
- Bond prices and commodities trend in opposite directions
- Bonds and stocks normally trend in the same direction
These relationships are particularly strong in an inflationary environment but change significantly in a deflation (more discussion below).
Commodities and Stocks – Intermarket Analysis
If you apply some rudimentary deductive reasoning to the two principles above, you should be able to conclude that commodities and stocks frequently trend in the opposite directions.
A recent article from Chris Ciovacco illustrates this pretty well and shows the nearly persistent negative correlation between commodities and stocks during the past equity bull markets.
The current bull market is no exception as commodities have been on a nearly steady decline since 2011.
So, how does this example of intermarket analysis help us identify possible turning points?
A reversal in commodities and shift from relative weakness to strength typically signals the approaching end of a bull market in the U.S. equities.
An interesting quote from Murphy on this topic: “Rising oil prices have contributed to virtually every U.S. recession in the last forty years. 1999 was no exception.” (Neither was 2007 in my opinion.)
An effective way to visualize an intermarket relationship is via a “ratio” chart where prices of two assets are divided. Below is such a chart (20 years, weekly) of the key commodity and U.S. equity indices.
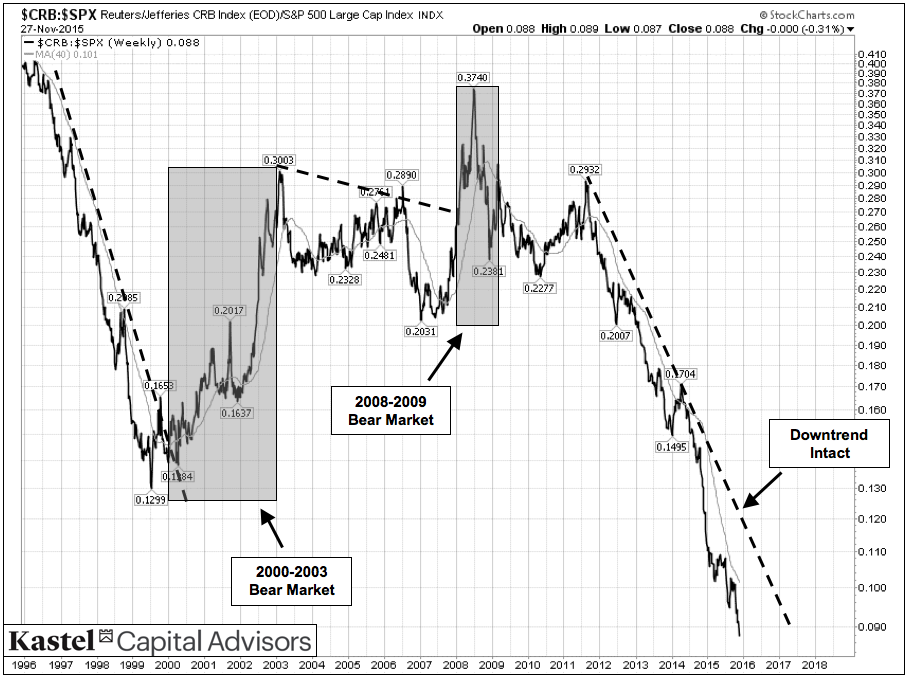
Commodities trended lower against the U.S. equities for much of the go-go 1990s. The reversal of this relationship in 1999/2000 (partly influenced by rising oil prices) and the ratio’s push over the downward trendline gave a clear signal of a major turning point and the end of the secular equity bull market in the U.S.
Similarly, significant relative strength in commodities in 2007/2008 and the ratio’s push over the trendline coincided with another equity bull market end.
Finally, and despite the minor run up in 2011, the ratio has been in a clear downtrend during the current U.S. equity bull market and there are no signs this relationship is about to change.
In the following examples, we’ll take a look at the intermarket relationship of Bonds and Stocks.
continue reading on the next page…


 Ready To Break Out?")


