We are dealing with many of the same themes, so my plan is to keep this week’s S&P 500 weekly update short and to the point. Feel free to go back and read last week’s update for more color. In short, not very much has changed except for the counter-trend rally attempt.
We experienced another week of selling BUT FINALLY crude oil woke up and rallied. This may be a short term low or even a lasting bottom but either way caution is still warranted. The chart has experienced several weeks of controlled selling and has a ton of technical damage so careful.
Same goes with the S&P 500 weekly update chart (but we’ll look at that later on in the article).
Coming into the week, the markets were very oversold. And just as I thought, the charts stayed oversold until we saw the big reversal middle of last week. That occurred after the McClellan Oscillator ($NYMO) hit some historic oversold levels on an intraday basis at -116.
This doesn’t show on the chart because it only shows daily closing prices but either way, the closing was equally oversold around -89. The Equity only put call ratio hit extreme levels that often provide a good gauge for a stock market reversal. And meanwhile the Volatility Index ($VIX) went over 30 briefly, only to retrace back inside its Bollinger Bands.
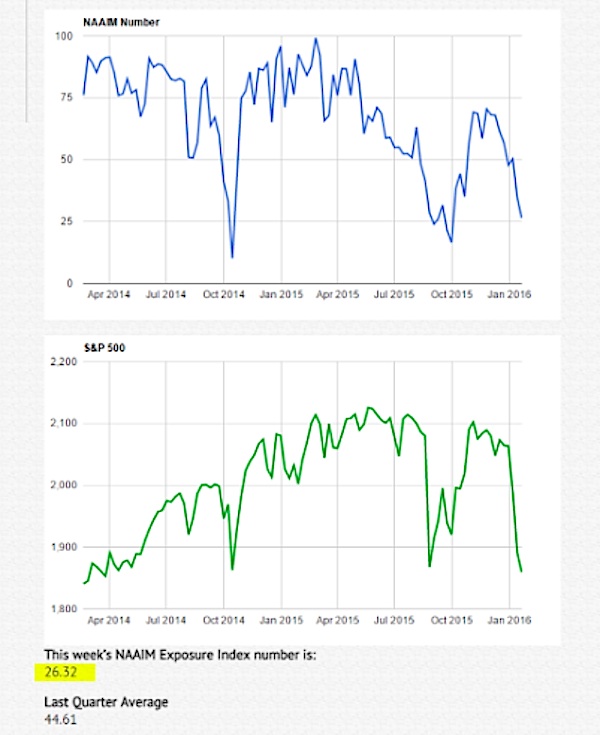
As well, investors became bearish – The NAAIM Exposure Index saw bulls drop to 26.32. This is good to see from a contrarian viewpoint. In all, there are ingredients for a lasting bounce… but it is still in the scope of a broader downtrend.
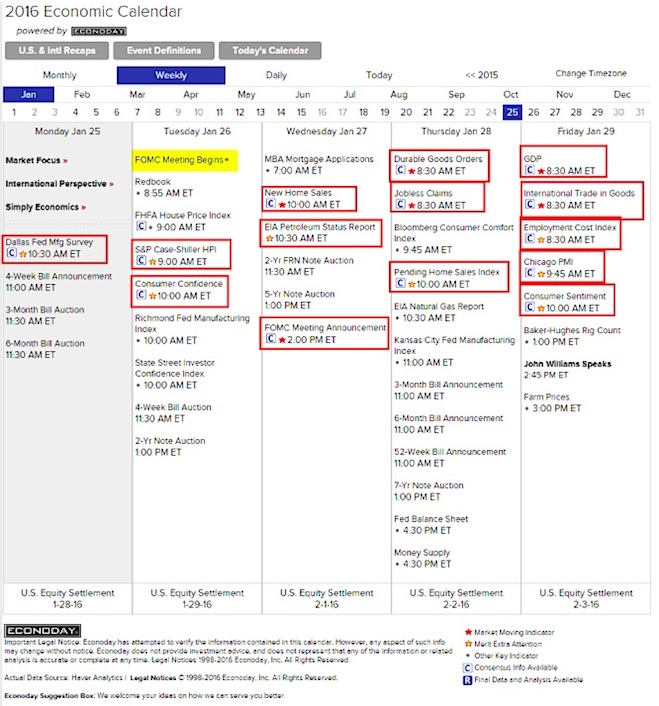
This week is a big week for Corporate Earnings with stocks such as $AAPL, $AMGN, $V, $AMZN, $MSFT, $FB and many more reporting. Earnings news has been secondary of late, so it remains to be seen whether they will provide any sort of catalyst.
Next on the list is the Economic calendar. We have the FOMC on tap along with GDP reporting. We also have some consumer related data with Consumer Confidence, Pending Home Sales, Consumer Sentiment, Durable Goods, PMI etc. Others will be watching the EIA Petroleum report for an impact on Crude Oil prices.
Stock Market Breadth Indicators:
From a market breadth standpoint, stocks are still facing an uphill batter. Here are some considerations.
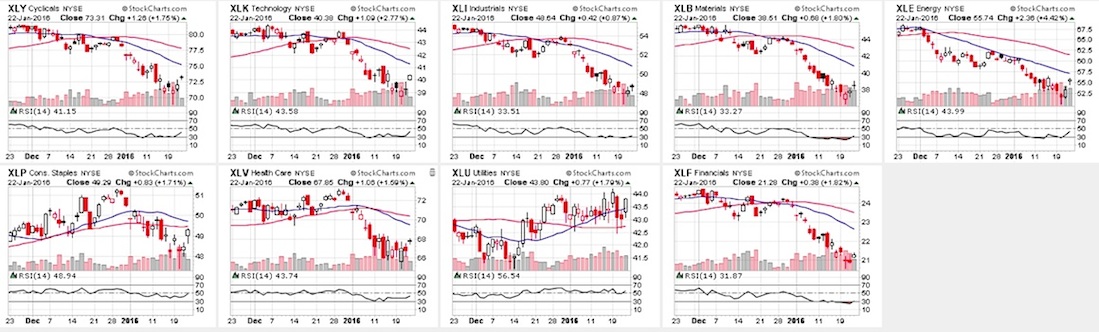
Sector Performance: A Candlestick glance
From a sector performance standpoint, several sectors are out of the oversold levels per their Relative Strength Index (RSI). The Financials ($XLF) has been the laggard along with Materials ($XLB). But this has been this way for a while – would like to see some buying there this week.
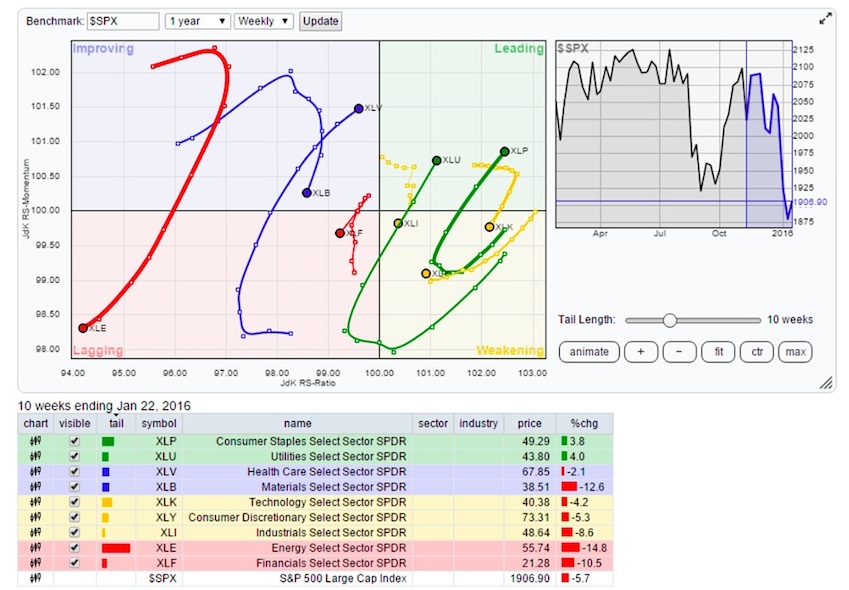
The Relative Rotation Graph (RRG) chart shows leaders and laggards across the 9 stock market sectors.
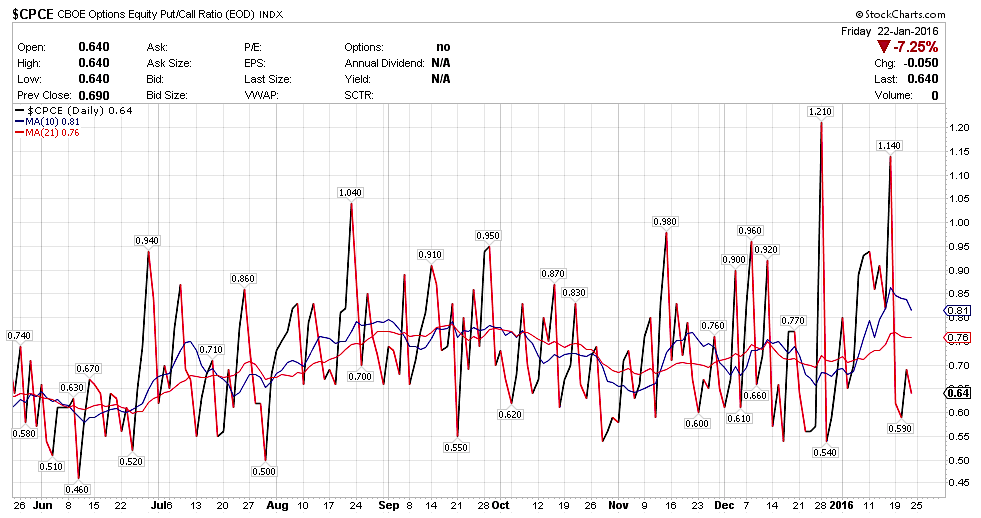
CBOE Options Equity Put/Call Ratio – $CPCE
The Equity Only Put/Call ratio spiked above 1.1 towards 1.14 last week. That is up near historic levels going back several years. This could be a reversal signal for stocks but as I stated earlier in this S&P 500 weekly update, there is much work to be done. Fear felt real last week, but it was noticeable that the $VIX didn’t spike to a similar degree (just getting over 30 briefly).
NAIIM Stock Market Exposure Index – Drops To 26.32:
The NAAIM Exposure Index represents the average exposure to the U.S. stock market. The green line shows the close of the S&P 500 Total Return Index on the survey date. The blue line depicts a 2 week moving average of the NAAIM survey responses. Last week’s survey number came in at 26.32. This is in sync with the decline, but moves us closer to a more meaningful bottom.
continue reading on the next page…


