The S&P 500 Index (INDEXSP:.INX) has experienced both downside and upside breakout attempts during the last couple weeks. However, the major stock market index remains largely range-bound, albeit with a bullish bias. Price movement back to new highs appears likely early in the week before a stalling out, potentially led by a slowdown in Technology.
Key Takeaways
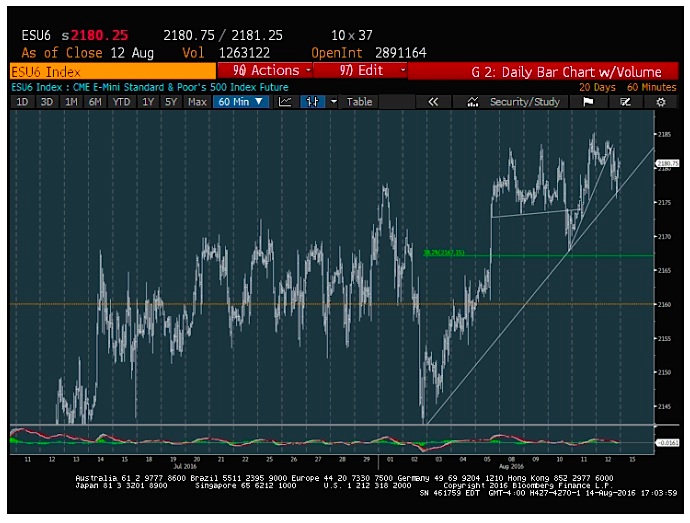
The S&P 500 trading range remains intact, albeit with increasing strength in various other stock market indices, such as the Dow Jones Industrial Average (DJIA) and NASDAQ Composite. The latter two majors have now joined the S&P 500 back at all-time highs. Many may express skepticism about the markets being in a trading range, but how else can one explain last Friday’s (8/13) closing within two points of the exact same levels as hit the prior Friday (8/5) at 2182.87.
In fact, in the last month, the S&P 500 has nudged higher, at 2184.05 vs 2163.75 on 7/14. So increasingly the move in Large-cap stocks appears to have largely stalled out over the last month.
This isn’t 1999 all over again. But, if anything, 2016 looks to be weaker in many ways. We’ve heard countless chatter about this being the first occasion all three major indices have hit new highs in unison since 1999. While this is certainly a constructive move back to new highs in recent weeks, and this can be confirmed by Advance/Decline at new highs while Momentum remains positively sloped, 2016 is a far different market than that seen in 1999. And, if anything, is in technically in worse shape. Stock market indices like the Transportation Average and Russell 2000 index remain far off highs seen back in 2014/15. As well, the S&P 500 has diverged substantially from most of the developed and Emerging markets world in the last eight months.
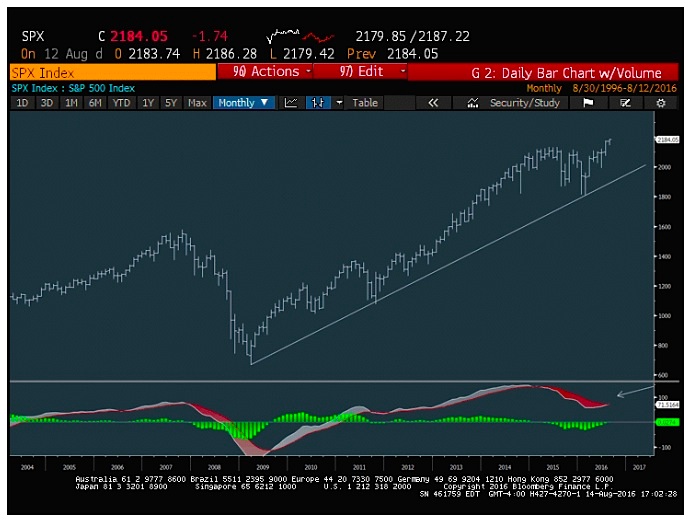
Monthly momentum indicators such as the MACD were bearish over the last year up until last week. And they will have difficulty reclaiming the highs. This appears to be the beginning of possible bearish divergence on monthly charts. While it’s right to favor US Large Caps given that the US equity markets have clearly led in this outperformance, there should be an attempt either for S&P 500 to peak out in the weeks ahead, or for global stocks to begin closing the gap on the US. That said, there’s no discernible evidence of immediate mean reversion.
Technology looks to be reaching near-term areas of upside exhaustion. This may cause the broader market to face headwinds, given Technology’s 20% weighting in the S&P 500 Index (the index’s largest component). Most of this thinking comes from the presence of a Demark 9-13-9 pattern, which could be complete early this week in the NASDAQ 100 and NASDAQ Composite (as well as the ETF, XLK).
Any slowdown in Technology would likely translate into the market becoming much more selective heading into a bearish seasonal time, and signs of trend reversals are a must for both XLK and the NASDAQ. For now, the next 2-3 days seem to be important in this regard for signs of exhaustion to appear when using TD Sequential and TD Combo indicators. This could provide short-term signs of stalling out and consolidation on stocks like FB and GOOGL which have made steady progress in recent weeks, and both of these look like poor near-term risk/rewards, along with MSFT after their gains of late. For the next couple days, there should be one final attempt to push back to new highs, but then would expect some stalling out in Tech. Overall, until these signals are in place and show some signs of working, the near-term trends remain positive. It remains tough just yet in fading equities based on a stretched positive trend with no completed 9-13-9 in place for the NASDAQ.
The Decline in Treasury yields and USDJPY certainly haven’t been reflective of a genuine shift towards risk assets. And despite the US stock market indices having moved back to new highs, we’ve seen some definite divergence in Treasuries also rising recently along with stocks. This obviously hasn’t just been a US phenomenon, as globally, interest rates continue to plummet towards new lows. However, one supportive factor important to keep an eye on his how well the High yield market seems to have rebounded. The Junk Bond ETF (JNK) continues to press up to new highs, and if anything, it’s proper to await signs of this starting to breakdown before adopting too much of a bearish tone for stocks. Commodities have stabilized somewhat, in the last week given US Dollar weakness, but still very little evidence of much technical damage in stocks.
Sector rotation in the last week was nearly the opposite of what had played out in the last month but generally the shift towards constructive sectors such as Consumer Discretionary, technology, Financials and Healthcare have been positive forces for Equities. Financials, for now, remains the sole “down” sector in YTD Performance, and stalled out last week, while having outperformed all other sectors outside of Technology in the rolling 30 days. However, this sectors gains have occurred despite a pullback in treasury yields in the last couple months.
Short-term Thoughts (3-5 days) : Bullish- The So-called breakout in SPX last week failed to gain much traction, though also failed to reverse meaningfully from 2183-5 highs in Futures, and prices largely remain range-bound near levels that were hit over a week ago. Movement back up towards highs looks likely again early in the week, and still very difficult not to expect new highs with Advance/decline at new highs and most US indices now having broken out to join SPX in the last couple weeks. While counter-trend signals look close to appearing on intraday charts of SPX along with QQQ, XLK, the patterns still largely look constructive for a push back up to new highs.
Intermediate-term Thoughts (2-3 months): Bearish – The combination of the divergences in indices hitting new highs the uptick in bullish sentiment along with markets entering a notoriously bearish time seasonally makes it likely that any pullback over the final five months of the year likely takes place in August-October. While momentum and breadth remain quite positive, most of the argument for fading stocks at this time is more of a counter-trend argument, which hasn’t yet materialized in the form of index weakness. However, Most cycles along with Demark indicators highlight the possibility of a stalling out/reversal in August. Given the fact that indices have moved higher into this period argues that the upcoming turn should be a reversal from market highs, not lows. Additionally, another intermediate-term concern which should be mentioned is the degree of deterioration in momentum which began last year into August lows. Even a rally back to new high territory won’t allow momentum to get anywhere near where it was back in late 2014/early 2015 and this is a 12-18 month concern. For now, for this time frame, additional intermediate-term strength still looks possible into mid-August, with key targets at 2180-5 and then 2250.
Thanks for reading and good luck out there.
Twitter: @MarkNewtonCMT
The author may have a position in mentioned securities at the time of publication. Any opinions expressed herein are solely those of the author, and do not in any way represent the views or opinions of any other person or entity.


