In just one week investors went from the possibility of a breakdown with the worst week of the year to another shot at the all time highs. Wow, what a run for the stock market!
A 3.27% gain last week registered as the best week of the year for the S&P 500. November tends to start strong, bottom out mid-month and end strong into and out of Thanksgiving week. A very strong seasonal pattern for the stock market indeed.
S&P 500 Weekly Review
To recap a bit, the market was on edge after the ghastly Paris terrorist attack, and a consensus fed rate hike in December. As well, crude oil prices have been weak, the US dollar strong, junk bonds weak, and hedge fund outflows etc. There were many reasons for the selloff in stocks to continue, but the bulls stepped up in an effort to retake momentum. And that has this week’s stock market review mildly bullish.
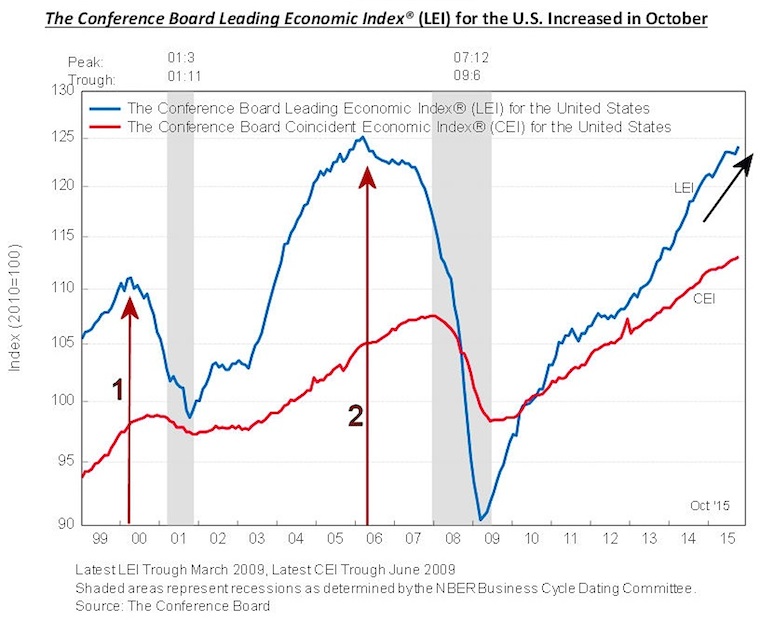
With corporate earnings season winding down, the natural expectation would be for a down move. So perhaps we see stocks consolidate or give back some gains after the holidays. There has also been a ton of talks on crude oil prices heading much lower. Note, though, that one positive from last week was November’s Leading Indicators. The reading came in at 0.6% and as of now recession talks are on hold.
As far as the Economic Calendar goes, even though it is a shortened week, there are quite a few big reports on tap. We have the 3rd Quarter GDP Revision on Tuesday along with Consumer Confidence, Durable Goods Order, Personal Income, Consumer Sentiment to name a few on Wednesday. The market is closed on Thursday – Thanksgiving Day and closes early at 1:00 PM EST on Friday.
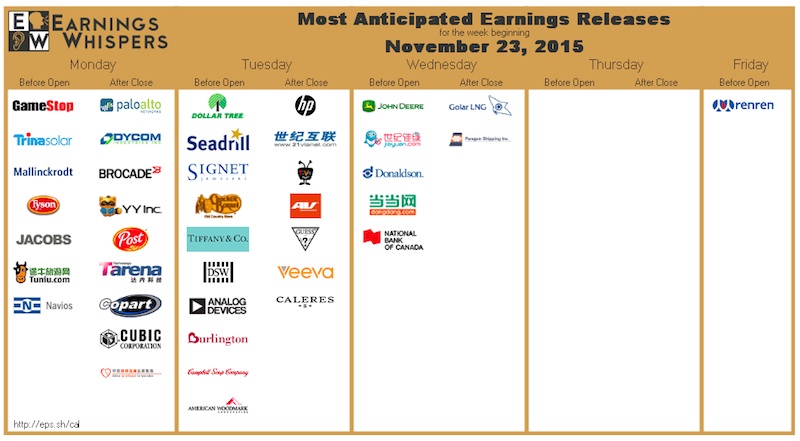
Here are some of the Earnings due next week via Earnings Whispers (@eWhispers). Not a whole lot but some interesting stocks like Hewlett-Packard ($HPQ), Tiffany’s ($TIF), John Deere ($DE) and Dollar Tree ($DLTR) report earnings.
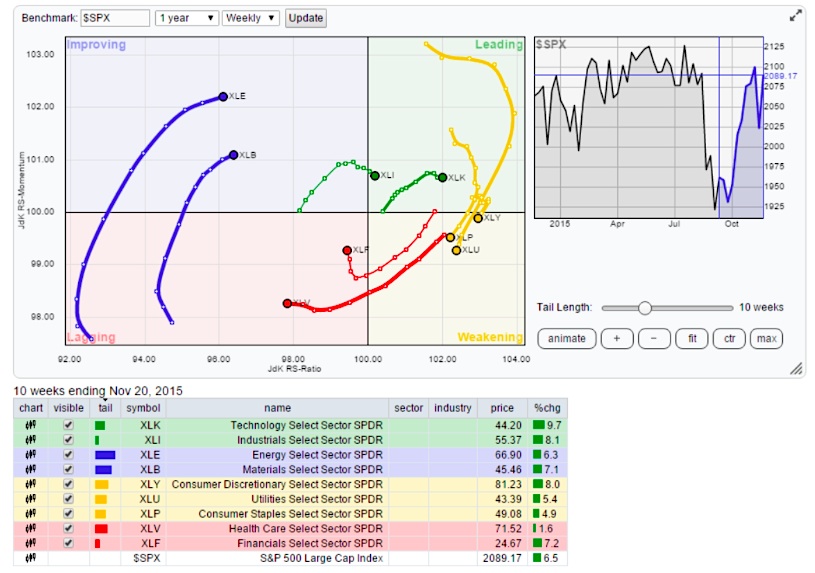
The Relative Rotation Graph (RRG) chart shows the leaders and the laggards among the 9 sectors.
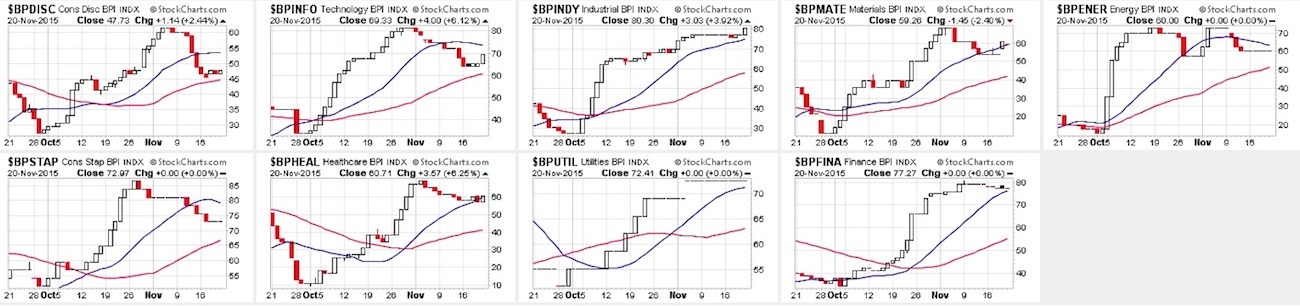
BULLISH PERCENT INDICES – EOD:
A pictorial representation of the Bullish Percent Indices. Mostly a complete reversal of last week across the various stock market sectors.
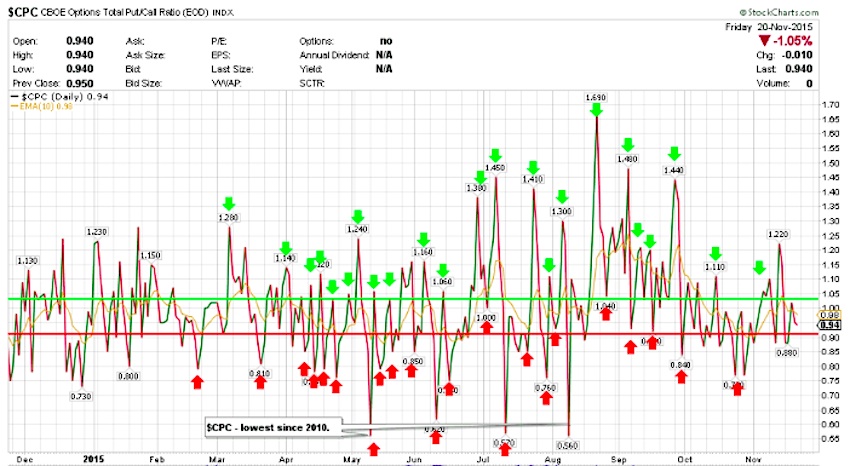
$CPC – Put/Call Ratio:
The Put Call ration ($CPC) has been meandering between 0.8-0.95. Overall, the Equity only put call ratio continues to fall and remains strongly in favor of the bulls. Also, the 21 day MA for Equity Put Call Ratio is still pointing lower after rolling over from the highs in October. The weighted ratio is also back to it’s bullish state. All this bode well for the stocks as long as it remains lower.
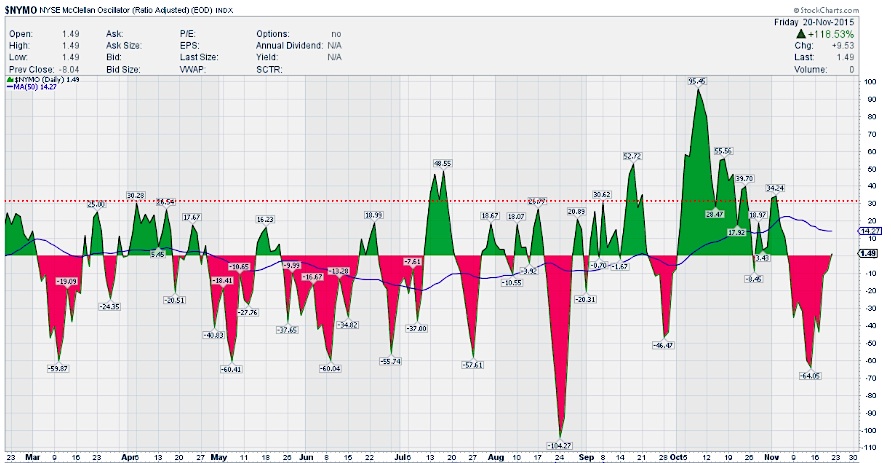
$NYMO (McClellan Oscillator):
The McClellan Oscillator ($NYMO) was way oversold last week and is back to neutral, just a tad over its zero line. It finished the week at 1.49. Looks positive for the week to come. $NYSI is about to turn and make a bullish cross and that bodes well for the upcoming sessions.
continue reading on the next page…
")


 Rolling Over At Key Fibonacci Level?")

 Ready To Break Out?")
