A while back I wrote an article to make a case for lowering expectations on long term stock market returns over the coming 10 year horizon. I’ve continued watching macro statistics to see if there are any new indications for economic direction. Market prices march on reflecting staying power to support the case for the sustained bull market run. However, I want to take a more focused study into the economic components underneath stock prices. More specifically, I want to explore the simplest factors composing S&P 500 valuations (stock valuations) which are a function of corporate earnings and the price earnings [PE] multiple. That previous article already dove into how far PE’s are stretched, so let’s take a different tack and study the earnings side of the equation instead.
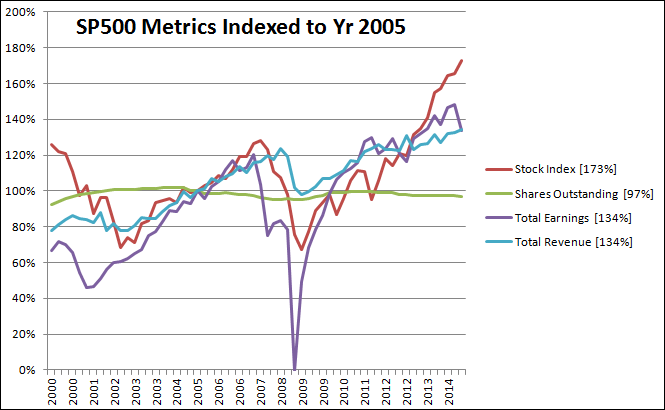
Corporate earnings are a simple product of total revenues times profit margin percentages. Let’s break down both to gain perspective and context for our current position. Below is a chart of Total Sales, Total Earnings and the S&P 500 Index. I’ve taken the data and forced mid 2005 to be the baseline for all the metrics in order to show relative movement over the last several years (note: it is completely my subjective bias to set 2005 as the benchmark year). Notice that the stock market has far outpaced both earnings and sales. The divergence could continue but is increasingly less likely. In 2007, earnings were the first to falter before the S&P 500 trailed lower. If that is a decent analog, we could now be in the first stage of a reversion to the mean as you see earnings in 2015 have begun to fall off.
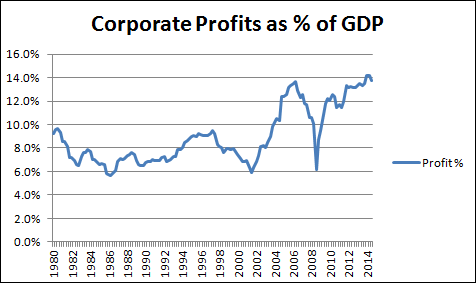
So the question that must follow is whether earnings are going to flatten out or drop. And if they drop that would likely pressure already lofty S&P 500 valuations. Here is a chart of corporate earnings expressed as a function of GDP from the FRED database with data back to 1980. Earnings margin percentages have a cyclical nature and oscillate around longer term averages. Current levels are stretched above those long term averages and in the last 2 quarter’s profit %’s have fallen. Dropping margin percentages will mean that for total earnings to stay at these high levels, total revenues will have to increase enough to entirely offset lower margins. This is just another consideration when trying to understand current S&P 500 valuations.
We can zoom in for a view at the S&P Indices sales data and earnings margins by sector. What should jump out at you is that sales are down $20 / share in Q1 2015 (not quite all companies have reported) and earnings margins are also down from the peak in Sept 2014.
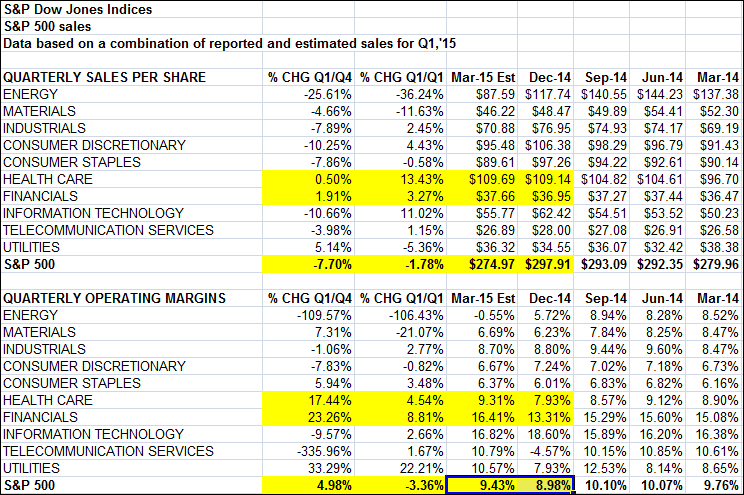
I’ve highlighted Financials and Health Care because they are carrying a larger weighting in contributions to S&P 500 earnings from last quarter and are helping the market reach and hold at recent highs. [For more in that regard, here’s an interesting study regarding the Banking Sector recent strength: Can The Bank Stocks Lead The Market Higher?] And we also see the health care stock sector is up about 9% YTD. Those sectors will have to continue the heavy lifting to maintain S&P 500 index prices at these levels.
To put a wrap on this, in the short term, only stock prices matter. PE ratios, S&P 500 Sales, Earnings and profit margins will never show up on our 401k statements. However, the fundamentals eventually assert their logical influence and trump the animal spirits reflected in today’s lofty PE ratios and S&P 500 valuations. If there ends up being too much of a gap between fundamentals and stock prices, we’ll be in for a wild ride as those forces reconcile. For all our sake, let’s hope that the gaps get filled regularly with small corrections and any dips in sales and earnings are short lived.
Twitter: @BBTompkins
Any opinions expressed herein are solely those of the author, and do not in any way represent the views or opinions of any other person or entity.


