The S&P 500 (SPX) closed last week at new all time highs. And the momentum carried over to Tuesday, as the index moved over the 2100 mark for the first time. Seems like a good time to reassess where we are, what hurdles we face, and where we might be headed (i.e. potential S&P 500 price targets over the near-term).
For some perspective, the S&P 500 is currently just 4 percent higher than its September 2014 highs. A move of 4 percent in 5 months isn’t noteworthy in and of itself. In fact, that stat is pretty boring when you consider the wild swings that took place during that time frame. Here’s a quick recap: There was a near 10 percent correction in October followed by a sling shot rally back to new highs. The S&P 500 then struggled with its 1.272 Fibonacci extension level at 2073 and pulled back another five percent in December… before rallying to new highs and pulling back another 5+ percent in January.
And now we are back at new highs again. Dizzying. So what’s next?
Back in late December, I penned a piece highlighting two Fibonacci extension levels that could act as upside S&P 500 price targets (magnets) into early 2015. But due to the recent market gyrations, I had to recalculate. Using the recent lows (February 2) and the prior highs (December 29) as my guide, I come up with 2124 (1.272 Fib) and 2163 (1.618 Fib).
Perhaps the market is gravitating toward 2124 now, and saving 2163 for later. Note that both of these should be taken in “trading” context – i.e. shorter term duration.
The S&P 500 is already up over 5 percent this month. Here’s some perspective: If we close the month at current prices, it would be the biggest percent gain for the month of February since Feb 1998.
Some other considerations:
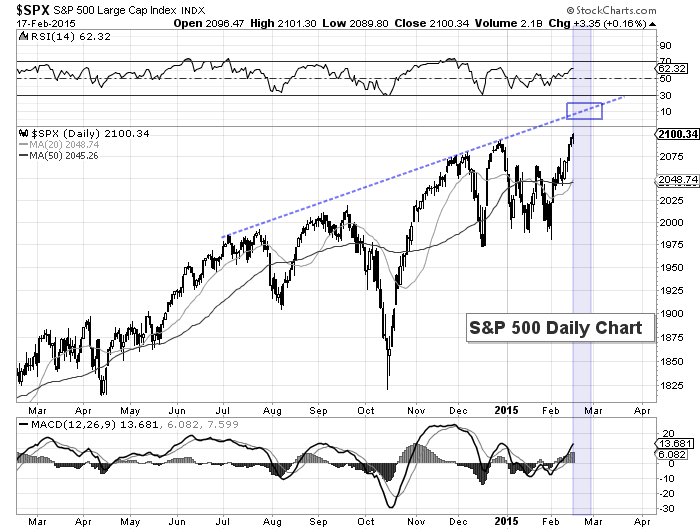
- The rising resistance line is around 2120. That could cap the rally over the near-term. Note that it will rise over 2130 into early March and so forth…
- The S&P 500 Futures are 2 bars into a sell setup.
- The 20 day moving average just crossed up through the 50 day moving average which confirms the bullish move higher. However, the current price is almost 3 percent ahead of it. This may bring some near term consolidation/back and fill, especially is the index moves to 2125 this week.
- The Index has been volatile and loosely rangebound since late November. Like a sideways grind, only slightly higher. A move above 2125 would confirm its ready to move to the next target: 2163.
Note that last year bottomed around the same time (Feb 3 last year) and ended up over 4 percent for the month. Already up 5 percent, how much higher can the market go in February? Thanks for reading.
Follow Andy on Twitter: @andrewnyquist
No position in any of the mentioned securities at the time of publication. Any opinions expressed herein are solely those of the author, and do not in any way represent the views or opinions of any other person or entity.


