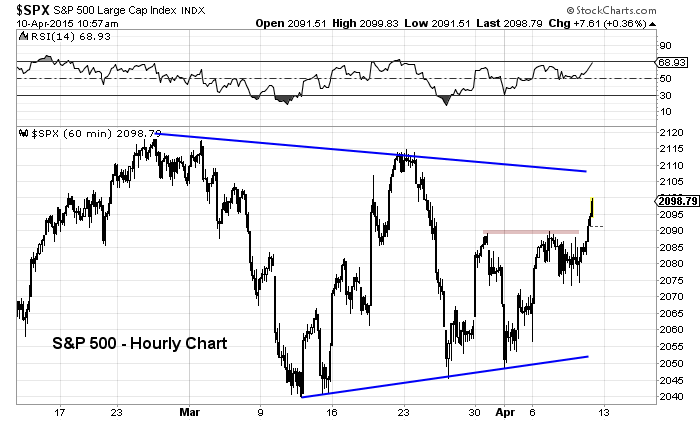
Since the February highs on the S&P 500, traders have been taken for a ride within a developing wedge pattern. And the recent rally in stocks looks set to test the upper edge of the wedge line.
Why?
The near-term rally broke out above near-term resistance on the S&P 500 at 2089 (March 30 and April 7 highs). I’ve been watching this level all week, and today it finally gave way.
The S&P 500 is now testing 2100 with room up to 2105-2110 (wedge resistance) if it wants it. What happens at that level will likely determine if this rally has a shot at new all time highs.
S&P 500 Hourly Bar Chart
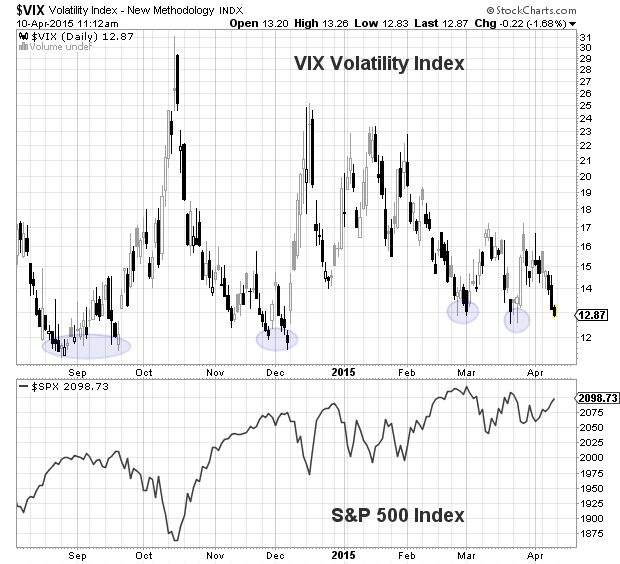
BUT, traders should be aware of one other potential fly in the ointment: the Volatility Index (VIX). It’s currently trading in the 12’s, and nearing levels where the S&P 500 has reversed course. A low VIX is not necessarily a bad sign; it often means the market is stabilizing and moving higher. BUT, considering the past 4 or 5 months of chop, it’s worth noting.
S&P 500 vs VIX Volatility Index
For traders, resistance levels reside at 2105-2110, then 2119. Near-term support levels now reside at 2089 and 2075. Trade safe.
Follow Andy on Twitter: @andrewnyquist
No position in mentioned securities at the time of publication. Any opinions expressed herein are solely those of the author, and do not in any way represent the views or opinions of any other person or entity.


