The S&P 500 (SPX) recovered nicely off the lows made this morning (1989.18). After spending much of the morning in negative territory, stocks rallied with strength in the afternoon, with SPX volume running slightly above average. BUT it’s also worth noting that this type of action fits in with the bigger picture market “chop” that we’ve seen for the past two months.
The move to the downside this morning offered a risk-defined trading opportunity into the S&P 500 January lows, but other than that, nothing has really changed from a technical perspective. We are still in a choppy market that is either biding its time for a move higher, or forming a larger top for a move lower. Let’s investigate a bit further.
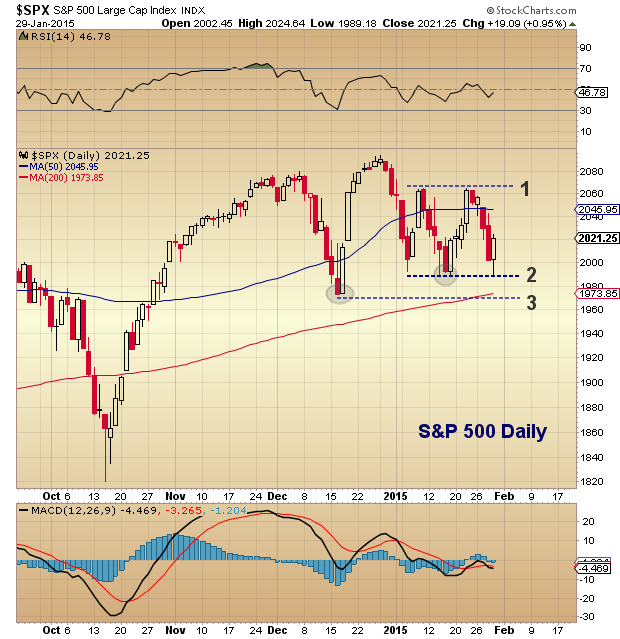
First, let’s talk about the January lows (1988.12) recorded on January 16th. Today’s action came awfully close to that level. And when considering the January 6th lows, a nice block of S&P 500 technical support has formed around 1988-1992. Should this level fail, then comes the December lows (1972.56). Below that level and there is a large air pocket that could see the S&P 500 test 1900 or even 1850. Note that I mentioned this on today’s Benzinga Pre-Market Show – my interview starts at the 1:01:30 mark).
But, that doesn’t mean that the bears are in control here… lower prices only come into view if the January/December lows break. Note as well that the Relative Strength Index (RSI) and MACD are still in no man’s land, albeit narrowing.
On the upside, the S&P 500 is staring at formidable resistance at 2064. This resistance was formed with the January 8/9 highs and January 22/23 highs. A move above this level would be constructive and increase the odds of new highs. Until then, the bulls and bears will continue to do the tango.
S&P 500 Daily Chart
Other internal indicators I’m watching:
20+ Year Treasury Bonds (TLT) – Investors continue to flock to long bonds. The key support level to watch here is $134-$135. Bulls would like to see this support level breakdown. Other defensives to watch include Utilities (XLU) and Consumer Staples (XLP). Continued strength in these sectors will indicate a rise in market uncertainty while weakness would raise the bulls hopes of rotation.
The US Dollar Index – It’s now at a point where investors are worried about its effect on the US economy. A pullback here could cure this worry short-term, while a firm or higher dollar will likely keep uncertainty alive and well.
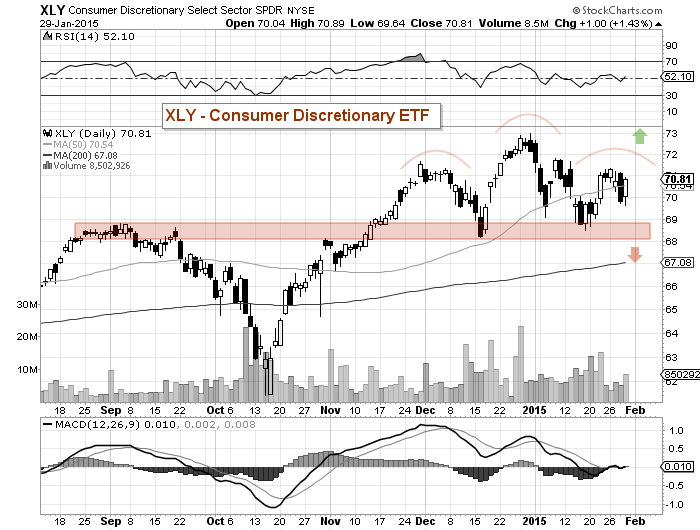
Consumer Discretionary ETF (XLY) – I wrote about the importance of the consumer earlier this week, and continue to think that this is an important market ‘tell’. Other than the obvious head and shoulder pattern (bearish if support breaks), the ETF is simply in a range. Above $72 would be bullish, below $68 bearish.
Trade safe. Thanks for reading.
Follow Andy on Twitter: @andrewnyquist
No position in any of the mentioned securities at the time of publication. Any opinions expressed herein are solely those of the author, and do not in any way represent the views or opinions of any other person or entity.


