May be it’s just because of the threat of an imminent government shutdown, an equally acrimonious debt ceiling debate still ahead and vaguely menacing downgrade talk from Moodys, but September/October 2013 has become highly reminiscent of July/August 2011.
The echoes aren’t limited to the politico-economic news cycle: markets have a hauntingly familiar look to them. Redolent of impressive moves earlier in the year lately given-way to hesitation, market analogs in the S&P 500 (SPX) and 10-Year US Treasury Note (ZB) are traversing paths of technically arresting deja vu.
Are domestic stocks and Treasuries signaling healthy consolidation; or will they follow their 2011 market analogs into a major reversal?
The S&P 500 remains well-ensconced in its primary up-trend, but it is cycling through a multi-month rising wedge. So far, that wedge isn’t making any waves; but it’s apex – and it’s volatility-inducing resolution – are drawing near. 2011’s wedge broke down, became a head & shoulders top and then plummeted in early August of that year.
The chart below displays this and replicates the selloff path onto September-December 2013. A strict follow through on the analog projects sharply lower prices, with an SPX rapidly faltering toward 1400.
S&P 500 E-Mini Futures (ES) – Weekly: 2011-2013 Market Analogs (click image to zoom)
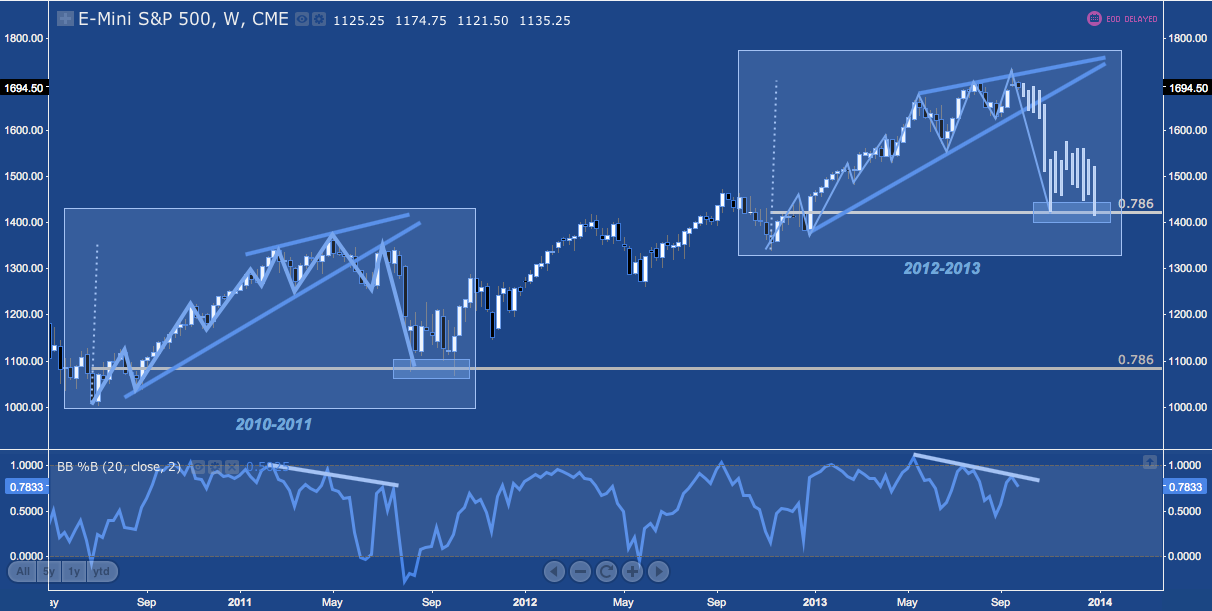
This market analog has plainly been building for some time: check out Andy Nyquist’s variation on it 2.5 months ago here.
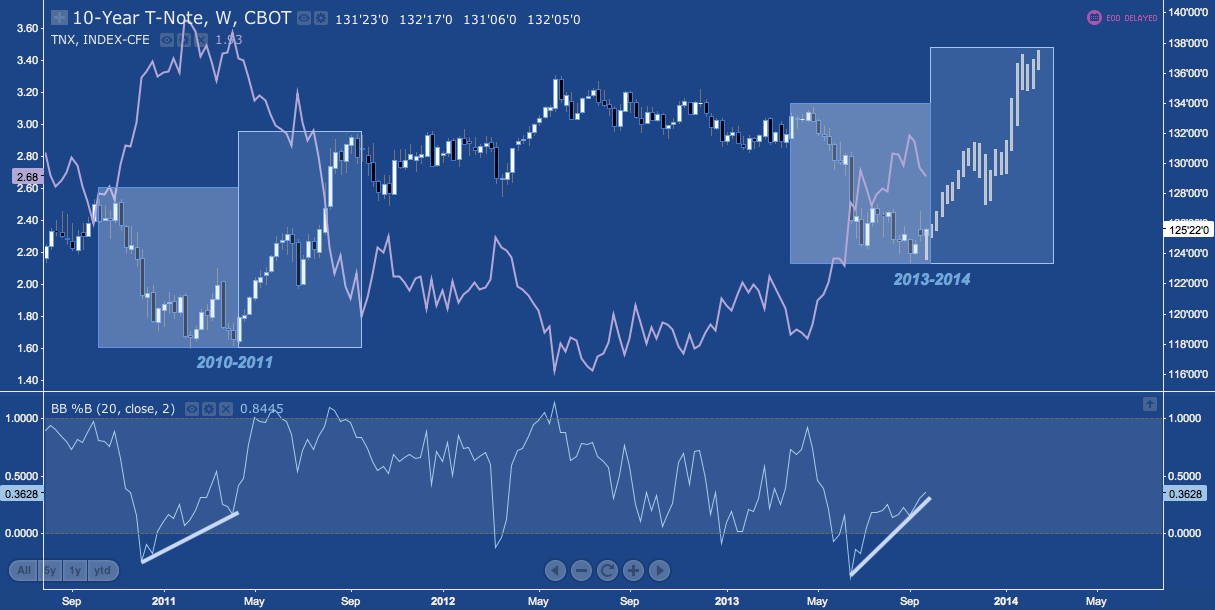
Turning to bonds, The 10-Year US Treasury Note (Futures: ZB; Yield: TNX) entered a bottoming pattern (a broadening bottom, often referred to as a “megaphone” pattern) in early 2011, posted a major positive divergence into May and then took off into the debt ceiling/downgrade crisis in late summer that year.
Fiscal policy dynamics are quite similar here, while monetary policy dynamics (teetering on the edge of tapering rather than launching Operation Twist 1) are not. In any case, like SPX, there is sound analog here. ZB (and consequently the 10-year yield) is roughly flat between the two timeslots and ZB is printing a tentative bottoming pattern on a strong positive %B divergence (see lower panel). May-October 2011’s path is replicated onto 2013-2014 here, suggesting (significantly) higher prices to come.
10-Year US Treasury Note (ZB, TNX) – Weekly: 2011-2013 Market Analogs (click image to zoom)
Twitter: @andrewunknown and @seeitmarket
Author holds no positions in instruments mentioned at the time of publication. Analogs illustrated are descriptive projections based on historic data, are not a forecast or recommendation and are included solely for illustrative purposes.
Any opinions expressed herein are solely those of the author, and do not in any way represent the views or opinions of any other person or entity.


