 After a few days of slow-go consolidation, the S&P 500 is thrusting higher again today. Although it is just 2 percent above the breakout plateau of 1900, it’s adding some mental pain to traders that are short. Yes, the market is getting stretched on multiple time frames. But, as most seasoned traders know, the “unlikely” can continue for longer than you think…
So let’s look at where the S&P 500 is currently, and what I’m seeing and watching here in June. And remember, time frames matter… especially when looking at setups and price targets.
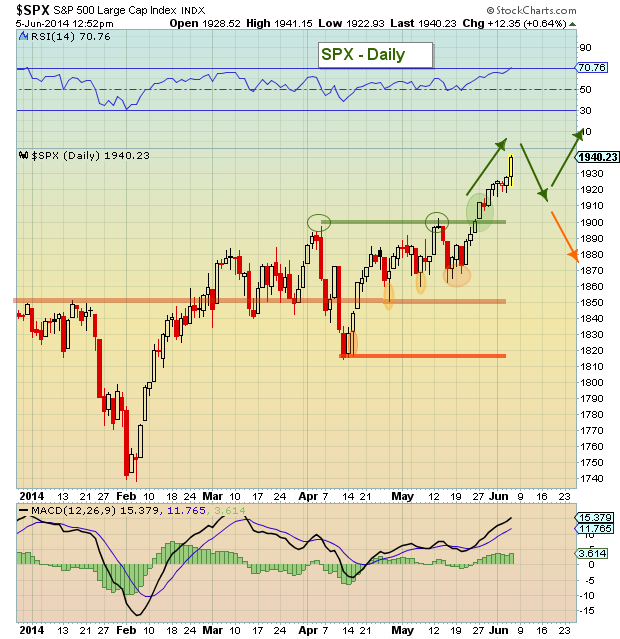
On the daily chart, the S&P 500 is on the second bar past a sell setup. So, we still should see some weakness emerge soon. Perhaps the index is setting up for a tag of the 1.618 Fibonacci Extension at 1949. This was one of the short-term price targets that I wrote about last week in a research note entitled “Mapping The S&P 500.” The daily RSI is at 70 so short-term momentum should begin to slow/stall into 1950. The zone to watch on any price weakness will be 1895-1905 (that’s the breakout support band). See daily chart below.
S&P 500 Daily Chart
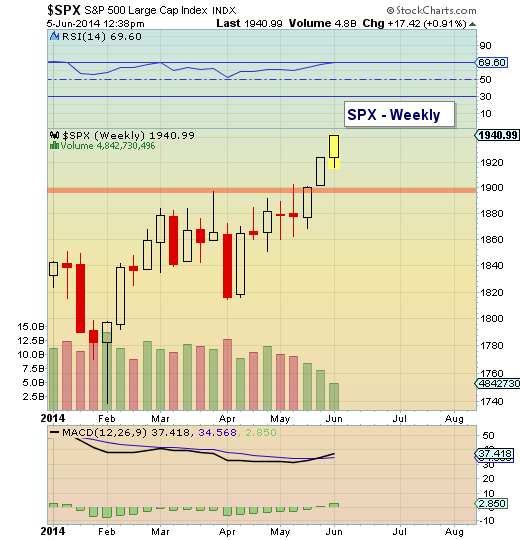
On the weekly chart, the S&P 500 is on bar 7 of a sell setup. This indicates that there is a good chance the index will reach new highs at some point over the next few weeks before a correction of any magnitude begins. This is why it’s good to be patient when looking for a top. If that is your style, you may want to broaden your time horizon or patiently build / trade around your positions. On the flip side, if you are long and strong, you may want to put a plan together that includes selling into strength and/or some upside targets (downside stops).
If the index “stretches” higher over the coming weeks, I see two possible price targets: 1980 (measured move higher) and 2032 (2.618 Fib extension). Those targets are roughly 2.1% and 4.7% from here, so near-term upside is somewhat limited.
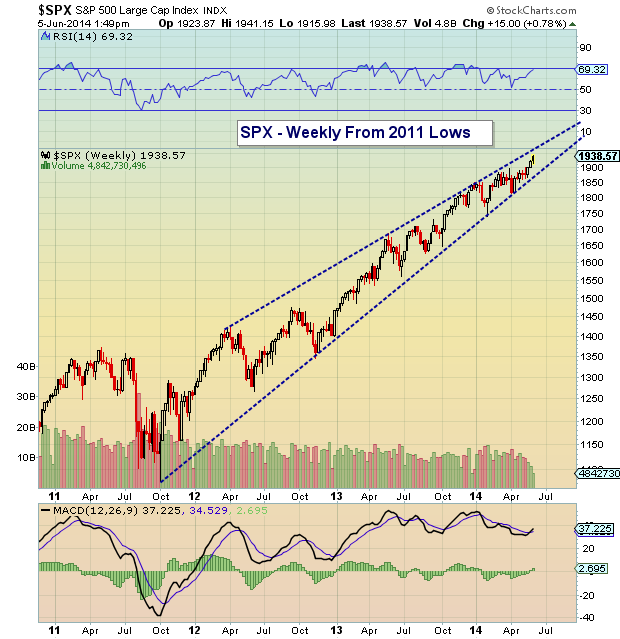
S&P 500 Weekly Charts
Putting the two time frames together says that caution is advised over the coming days, but that there is still a distinct possibility that the index roars one more time to new highs before a correction. Trade safe.
Author has a trading position in SH (the short S&P 500 ETF) at the time of publication. Any opinions expressed herein are solely those of the author, and do not in any way represent the views or opinions of any other person or entity.


")


