 By Andrew Nyquist Earlier this afternoon the S&P 500 dipped below 1540 before quickly recovering and recapturing this important S&P 500 technical support level. Was this a “warning” sign, or just a mini shakeout of weak hands? Well, we’ll likely find out in the coming trading hours as the S&P 500 closed just above this level.
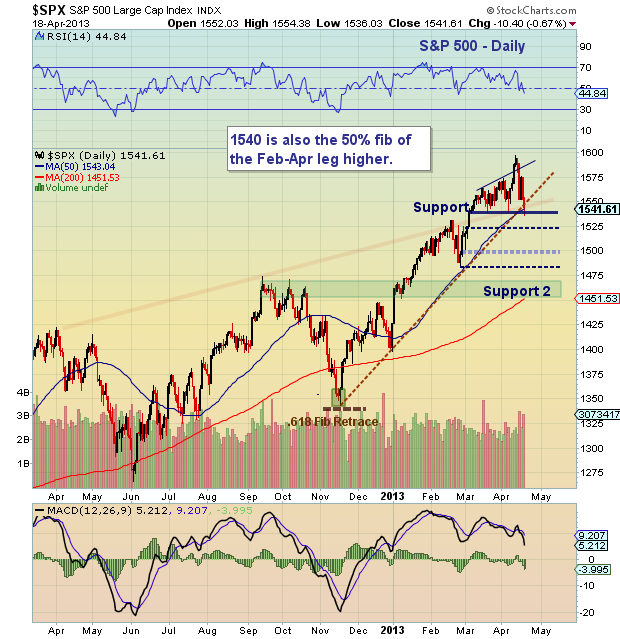
So, what makes 1540 such an important S&P 500 technical support level? Well, for starters, 1540 has served as a platform of backstop support for “dips” since the late February/early March break higher. It also represents the 50% Fibonacci retracement level of the February through April run higher. And finally, it coincides with the November to April uptrend line and 50 day moving average.
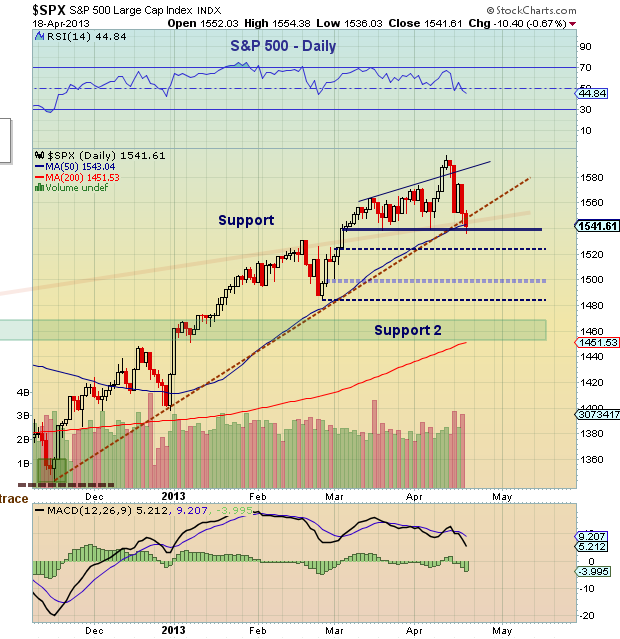
Should price action break below 1540, other S&P 500 technical support levels would come into play around 1520-1525 (gap-fill), 1500, 1485, and 1470. Note that 1500 and 1470 are major Fibonacci support levels. Both 1500 and 1470 represent the 38.2% and 50% Fibonacci retracements of the November through April run higher. Note 1470 is also near the September highs. Trade safe, trade disciplined.
S&P 500 Technical Support Levels – Daily Chart
S&P 500 Technical Support Levels – Daily ZOOM Chart
Twitter: @andrewnyquist and @seeitmarket
No position in any of the mentioned securities at the time of publication.
 Ready To Break Out?")


 Ready To Break Out?")
