 The stealth downdraft that occurred last week has offered little more than intraday trading opportunities for the nimble (and surgical). The added volatility has its benefits for traders of “both sides” but it isn’t for everyone. As I type, the S&P 500 is at 1920, roughly the mid-point of today’s range and just 9 points off the lows for this pullback. But price is nearing some important S&P 500 technical support levels, so I thought it would be good to take a few minutes to point out these levels.
The charts below highlight a few things that I think active investors should be watching/considering:
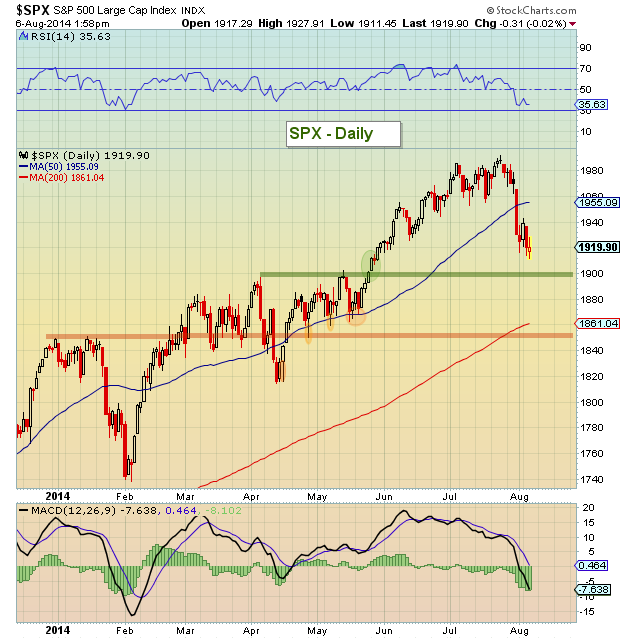
1) 1900 is an important S&P 500 technical support level. This level marks the last clean “breakout” for the index. Was this morning’s probe of 1911 enough of a retest? A deeper move below 1900 would likely target 1860-1870 (lateral support that coincides with the 200 day moving average).
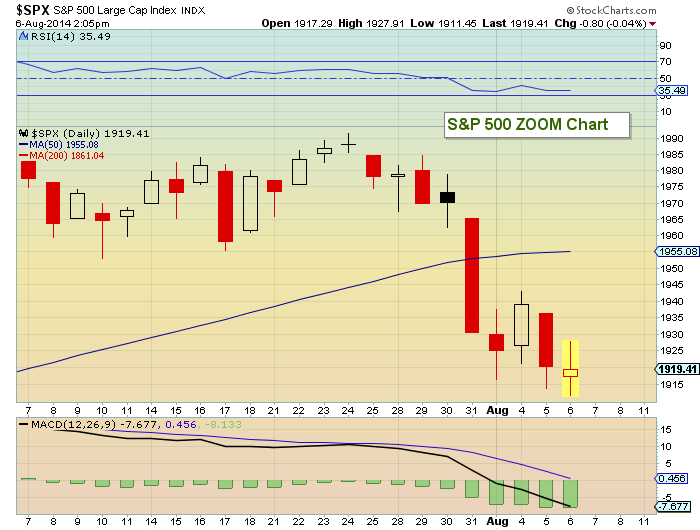
2) The S&P 500 is on bar 8 of a 9 buy setup. This is simply another short-term indicator, but it could increase the odds of a bounce sometime between now and the middle of next week, especially if we have another drop lower Friday or Monday. Ideally, I’d like to see a sub-30 RSI reading to set this up.
3) Risk is still high. Considering where price has gone and how long the markets have gone without a correction, it is important to stay disciplined and keep risk on a tight leash… bounce or not. Trade safe.
S&P 500 Daily Chart
S&P 500 Daily “Zoom” Chart
Thanks for reading.
No position in any of the mentioned securities at the time of publication. Any opinions expressed herein are solely those of the author, and do not in any way represent the views or opinions of any other person or entity.

 Rolling Over At Key Fibonacci Level?")

 Rolling Over At Key Fibonacci Level?")


