 Last week, with the market sitting on the edge of a deeper pullback, I posted an update about the importance of 1770 as S&P 500 technical support for active investors. Well, 1770 gave way on Monday, and opened the doors for a drop down to 1737 (lower wedge line support). This brought the pullback to just over 6% on the S&P 500. And nearly in lock-step, fellow SIM contributor Andrew Kassen posted a perfectly timed article about a coming market rally.
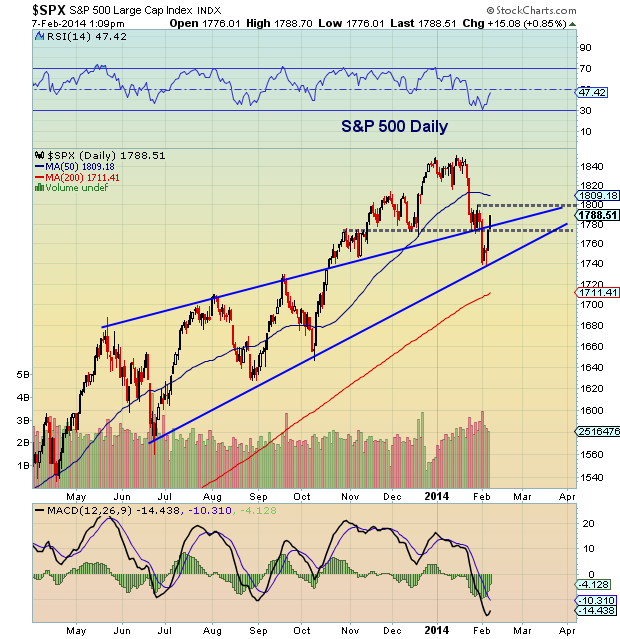
And rally we have. As I write, the S&P 500 is at 1788, up almost 3 percent off those lows. BUT, we are not quite out of the woods. Time frames do matter. And with all technical chart posts, we have to be aware of the time frame the charts (and analyst) are dictating, as well as when key support and resistance levels break. In this case, I am focused on the near-term, and the highlighted levels hold a time frame of “days.”
So what am I focusing on with the S&P 500? Well, since 1770 was taken out already, the next technical resistance level is 1800/1806. I mentioned both because 1800 is a psychological barrier and holds a feeling of strength; 1806 is the .618 Fibonacci “up” level. This is also near the 50 day moving average. A break above this area would be constructive.
The 1770 area comes in as initial support again. Should this level break down, the next support would come in at the 1737 lows. Another possibility would be another move lower, equidistant to the drop to 1737 (but we wouldn’t be able to identify this support until/when/if this rally ends).
S&P 500 Support and Resistance Levels – Daily Chart
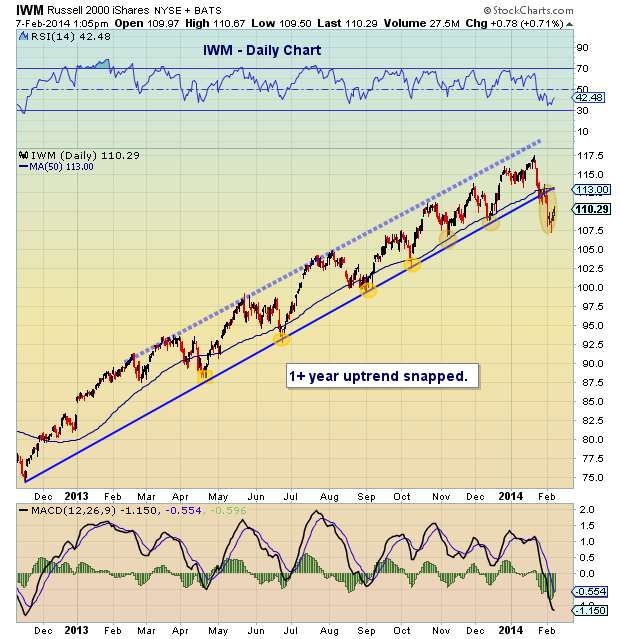
Another sector to focus on is the Russell 2000 (RUT) – Small Caps. Small caps have shown some weakness after strong leadership. A strong follow through day higher on volume would be very bullish. As you can see from the chart below, the Russell 2000 iShares (IWM) lost its 14 month uptrend. In the very near-term, this simply meant that stops should have served there purpose and offered for re-evaluation. $113 marks the 50 day moving average and the scene of the breakdown. I’ll be watching that level should the rally push higher.
IWM Daily Chart
Trade safe. Trade disciplined.
No positions in any mentioned securities at the time of publication. Any opinions expressed herein are solely those of the author, and do not in any way represent the views or opinions of any other person or entity.


