With stocks in pullback mode, it’s probably a good time to review some high probability setups on the popular index ETF, the S&P 500 ETF (SPY). Whether we see these dip buying levels or not, it’s good to store these readings and levels away in your investor toolkit.
The highest probability oversold dip buying level to enter the S&P 500 ETF (SPY) based on an oversold oscillator, is a reading of 30 on the Relative Strength Index (RSI) of the daily chart.
The highest probability dip buying opportunity for a moving average within a bull market, is the 200 day simple moving average.
Convergence is even better. The odds of a dip buying signal increases if multiple signals converge in one area on a chart. There is a potential for this to play out soon on the chart below.
If price gets to this dip buying level in the near future, I will be buying aggressively to play the initial bounce. Thanks for reading and best of luck.
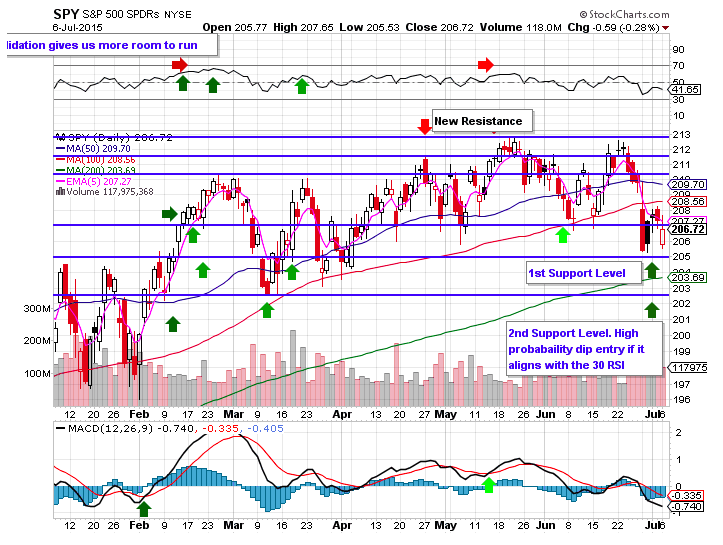
S&P 500 ETF (SPY) Daily Chart
Twitter: @SJosephBurns
Read more from Steve on his blog NewTraderU
The author does not have a position in any mentioned securities at the time of publication. Any opinions expressed herein are solely those of the author, and do not in any way represent the views or opinions of any other person or entity.

 Rolling Over At Key Fibonacci Level?")


 Rolling Over At Key Fibonacci Level?")