 Following the Federal Open Market Committee’s (FOMC) announcement on last Wednesday to delay LSAP/QE tapering in lieu of adequately encouraging economic data, the S&P 500 (SPX) sprang higher, producing a long green candle and just breaching the 1710-1720 cluster resistance that swatted it back in early August with a close at 1725.52.
Few things say technical strength like “all-time highs”. At least, on the surface.
Thursday continued the party with an opening gap up and AM trade as high as 1729.86. August 2nd’s high at 1710 rapidly receded in the rearview mirror as Bernanke’s unwillingness to take pressure off the QE accelerator encouraged yet additional risk-taking, much as it has the past 5 years. Here’s the S&P, slicing effortlessly the ceiling set for it during the Summer doldrums.
S&P 500 (SPX) – Daily
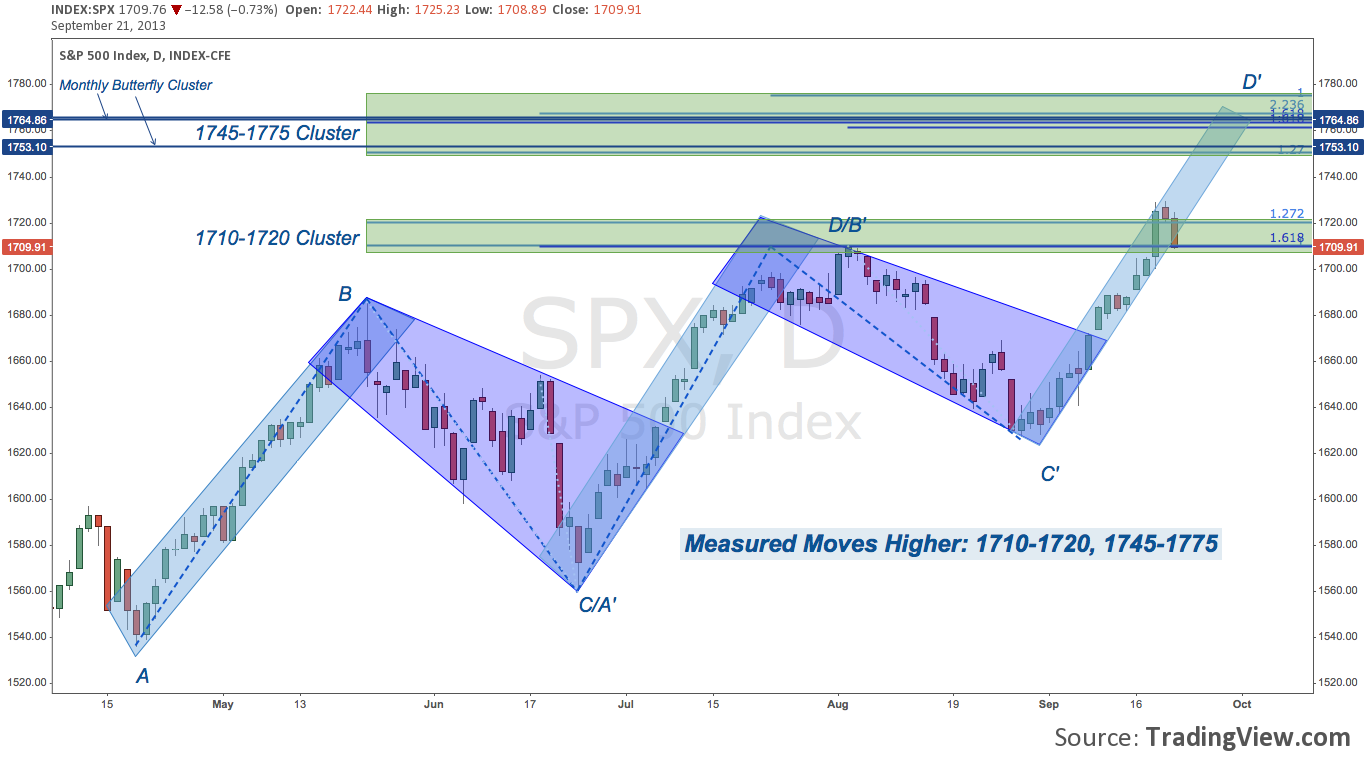
But Thursday closed near its low-of-day at 1722.34, modestly below Wednesday’s close. And then Friday: a very modest gap up (+0.1 points), trade back to 1 tick off Wednesday’s close; and then: selloff, gathering pace in the afternoon to close down at 1709.91 – 1 tick off of August 2nd’s high.
In the end, Wednesday-Friday effectively creating an evening star candlestick pattern that closed out the week on a decidedly bearish note, even while the primary SPX up-trend remains well-intact. Was this selloff (for perspective, note the 1710 close is barely 1% off the index’s all-time high) merely a move to consolidate the breakout over August 2nd’s top; or did SPX just install a sell-the-news post-FOMC bull trap that will kick off the next pullback?
Though this week was widely-heralded as pivotal for its policy significance, next week will be the technically decisive one in (at least) the short-term.
If Not Yet, Then Almost
Any time the S&P 500 encounters a major level, it is beneficial to review its component sectors: as much to determine what is working best and worst; but also to means-test the index by looking under the surface for technical stress fractures that may be indicative of early weakness.
In the 19 charts below, you’ll find a long-term and short-term chart for each S&P sector. The overarching message they convey? The S&P 500 is tired. Whatever the relative strength of a given sector, it is just below major cyclical (“cyclical” = 2007 to the present) resistance, just as SPX is just below a major ceiling at 1745-1775. “Tired” doesn’t mean “done” – the technical balance of evidence still suggests a move extending approximately 2% above Thursday’s swing high. But with justifiably ominous “dark cloud cover” and “bearish doji star” patterns appearing everywhere, next week may prove the S&P is just fatigued enough to take a major rest here.
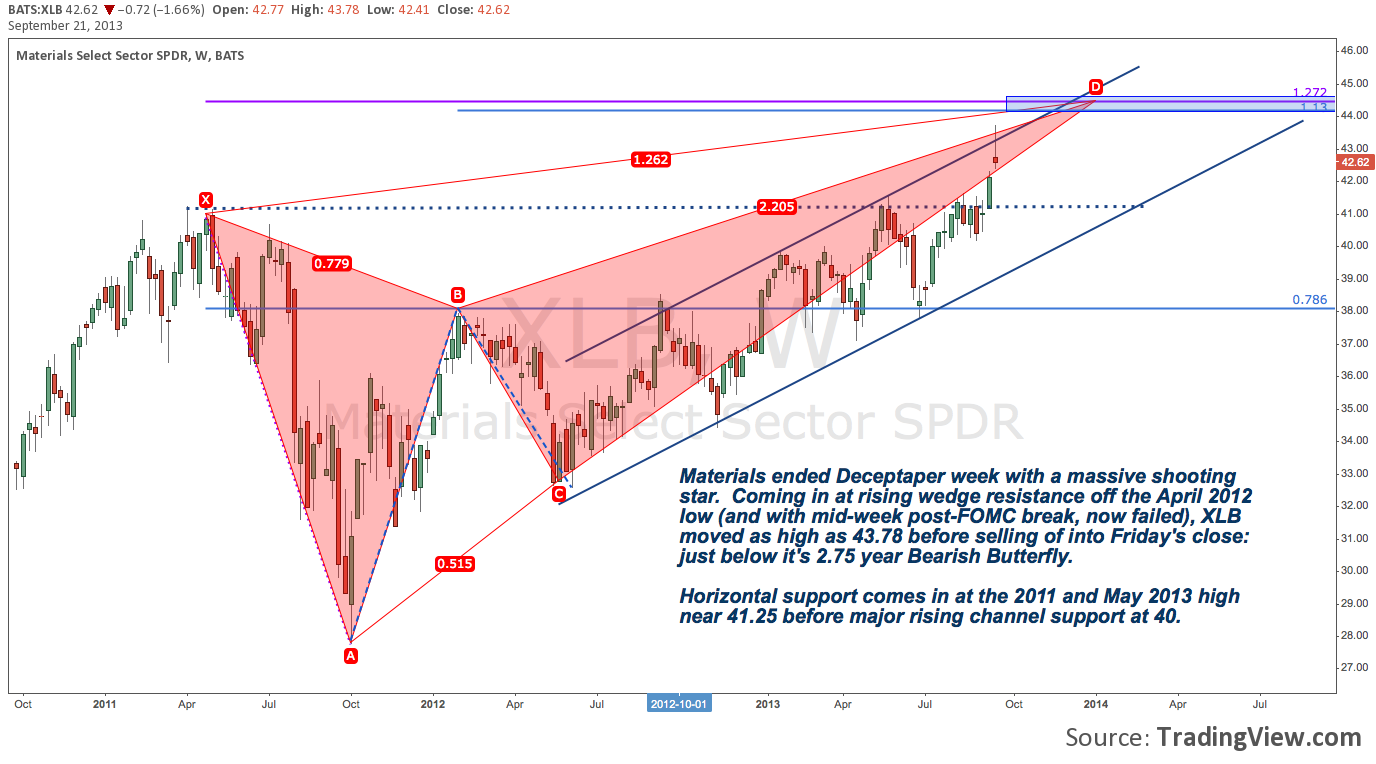
S&P 500 Sectors: Materials (XLB) – Weekly
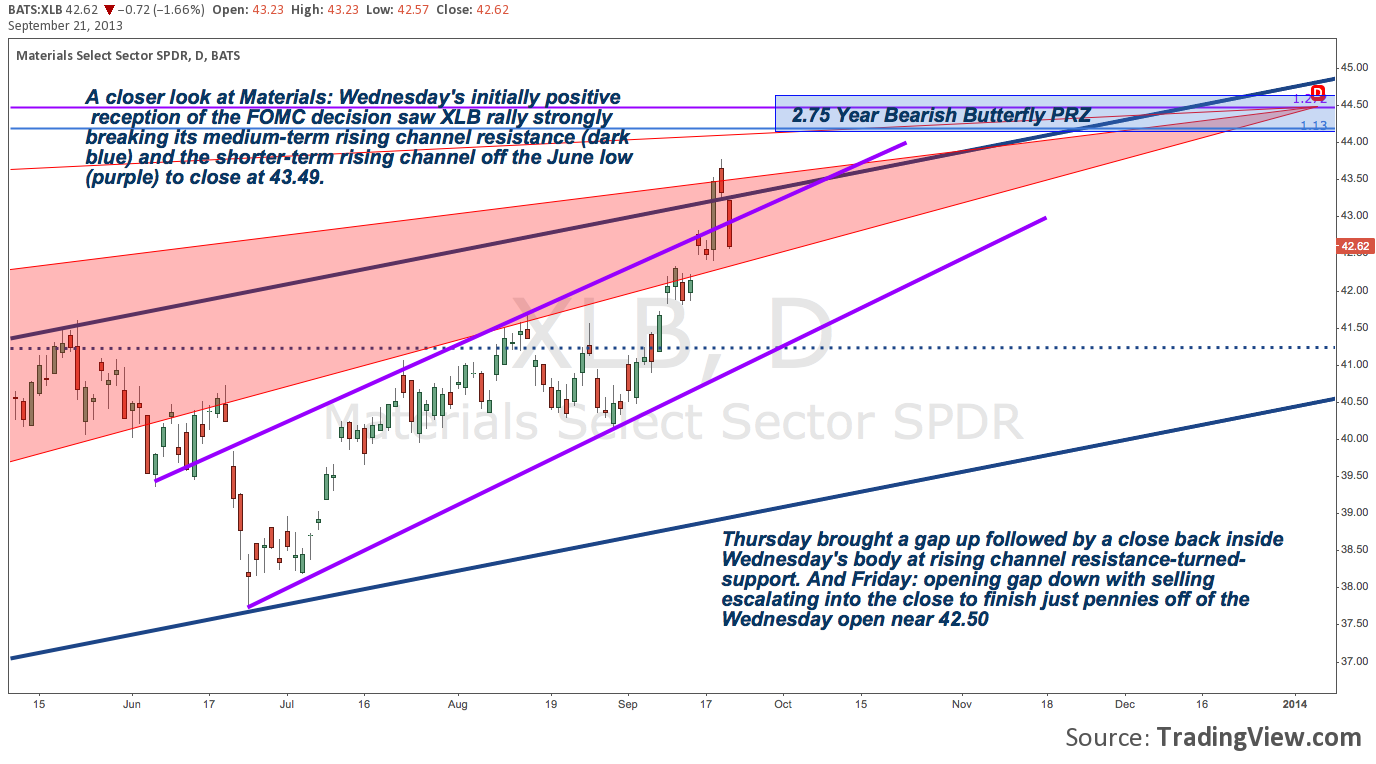
S&P 500 Sectors: Materials (XLB) – Daily
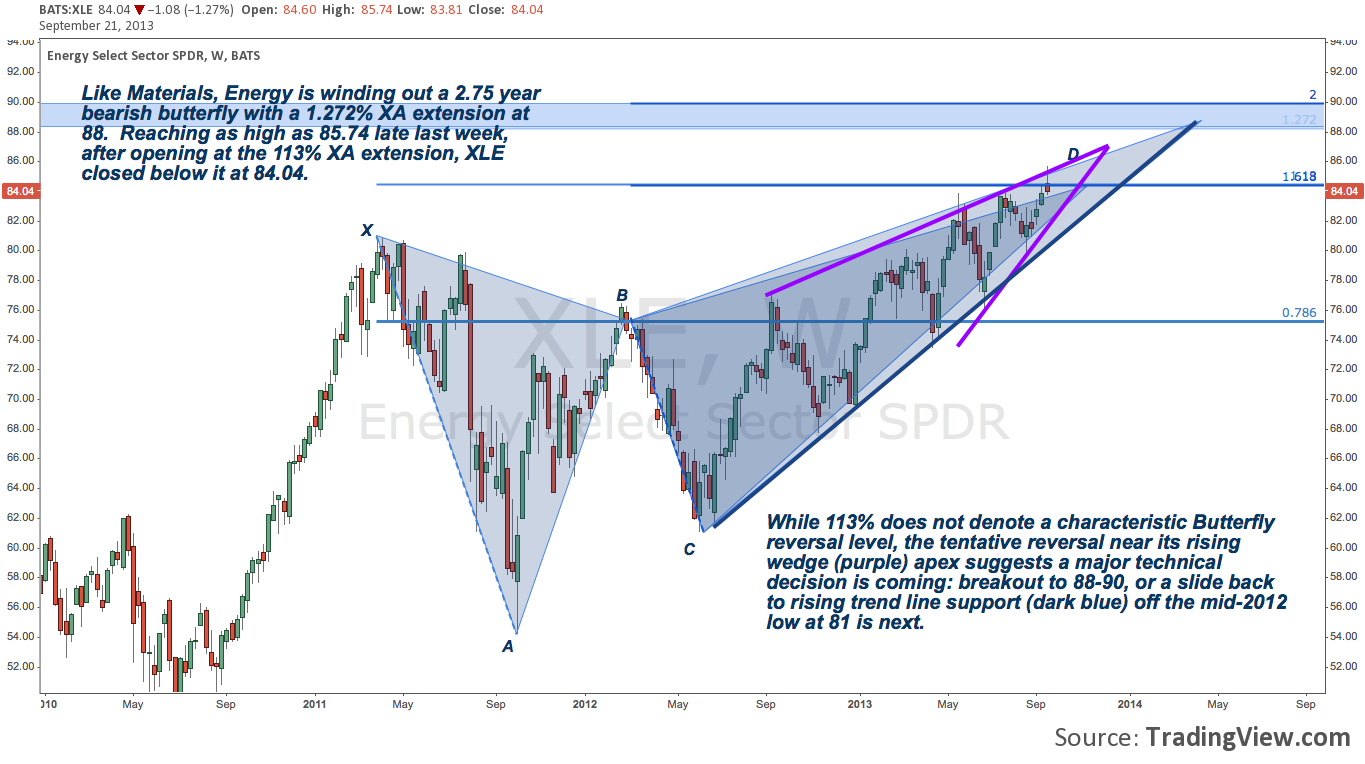
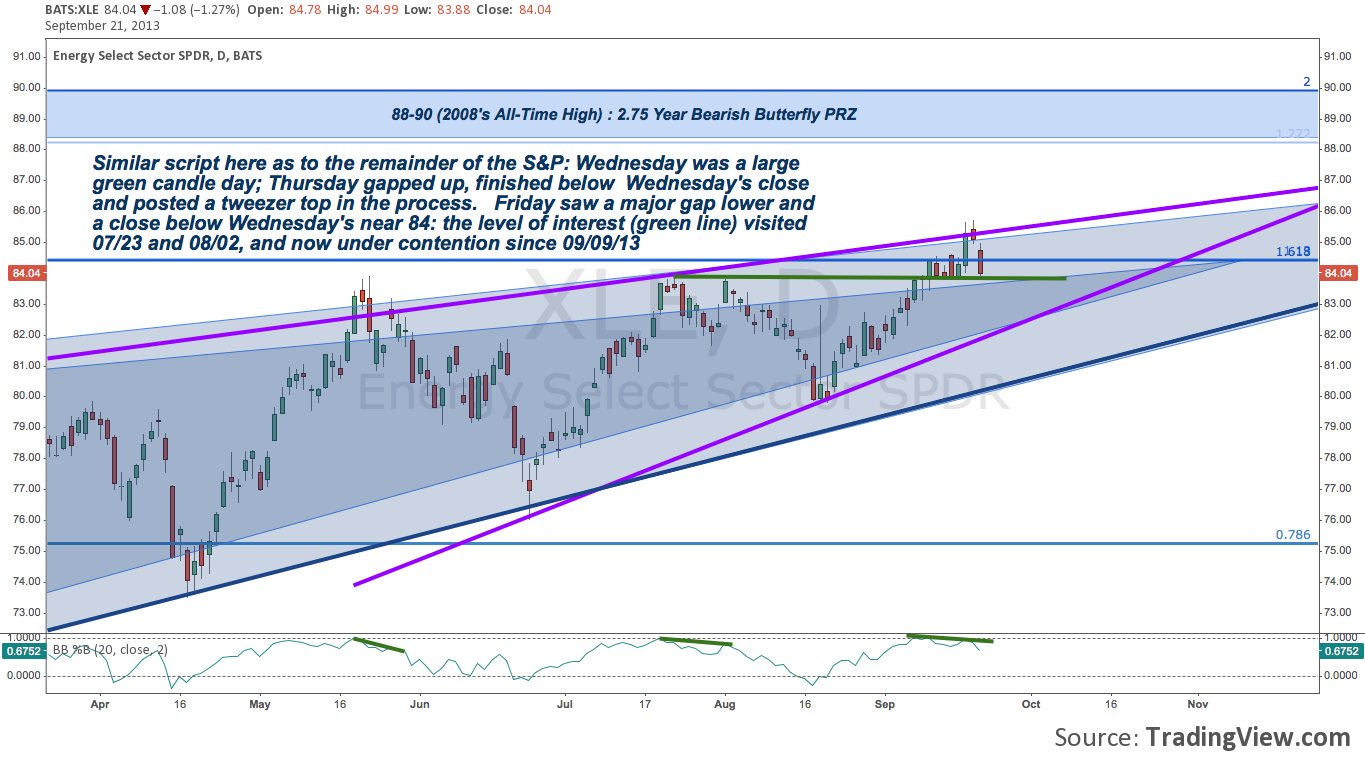
S&P 500 Sectors: Energy (XLE) – Weekly
S&P 500 Sectors: Energy (XLE) – Daily
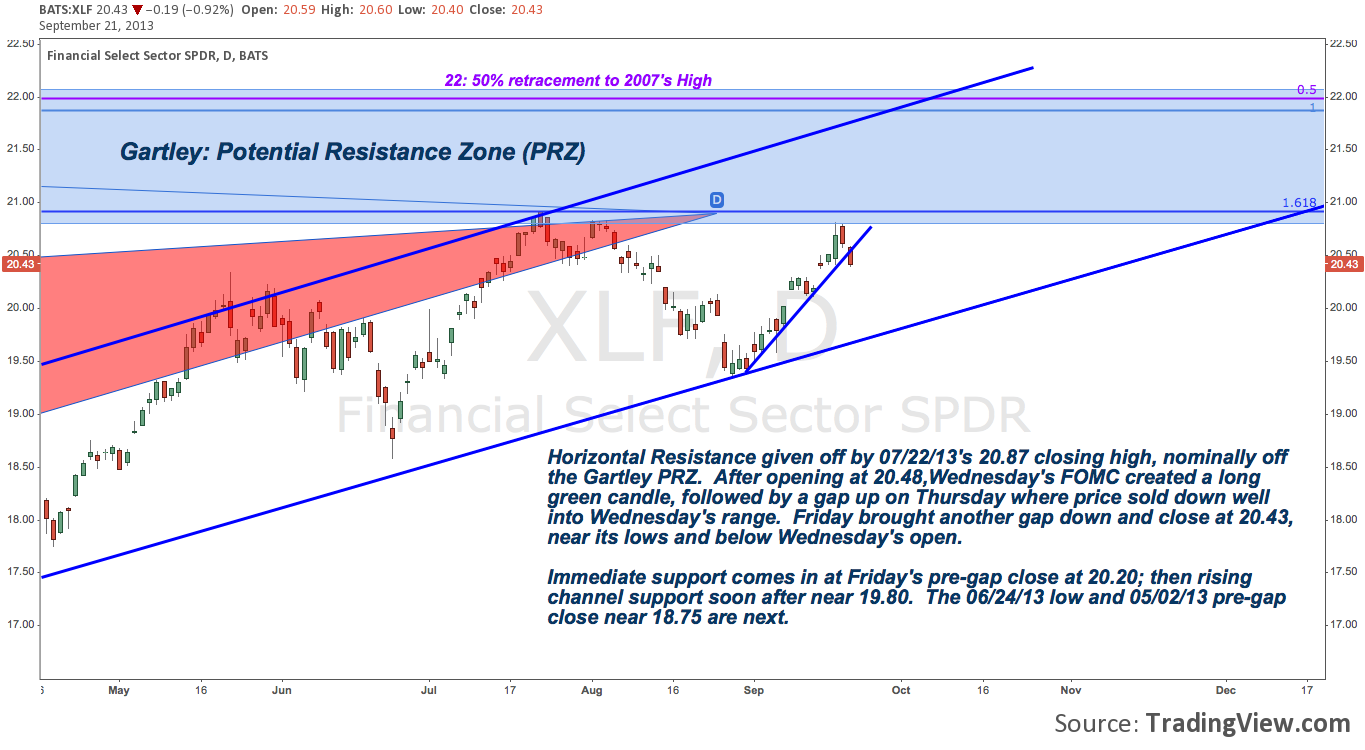
S&P 500 Sectors: Financials (XLF) – Weekly
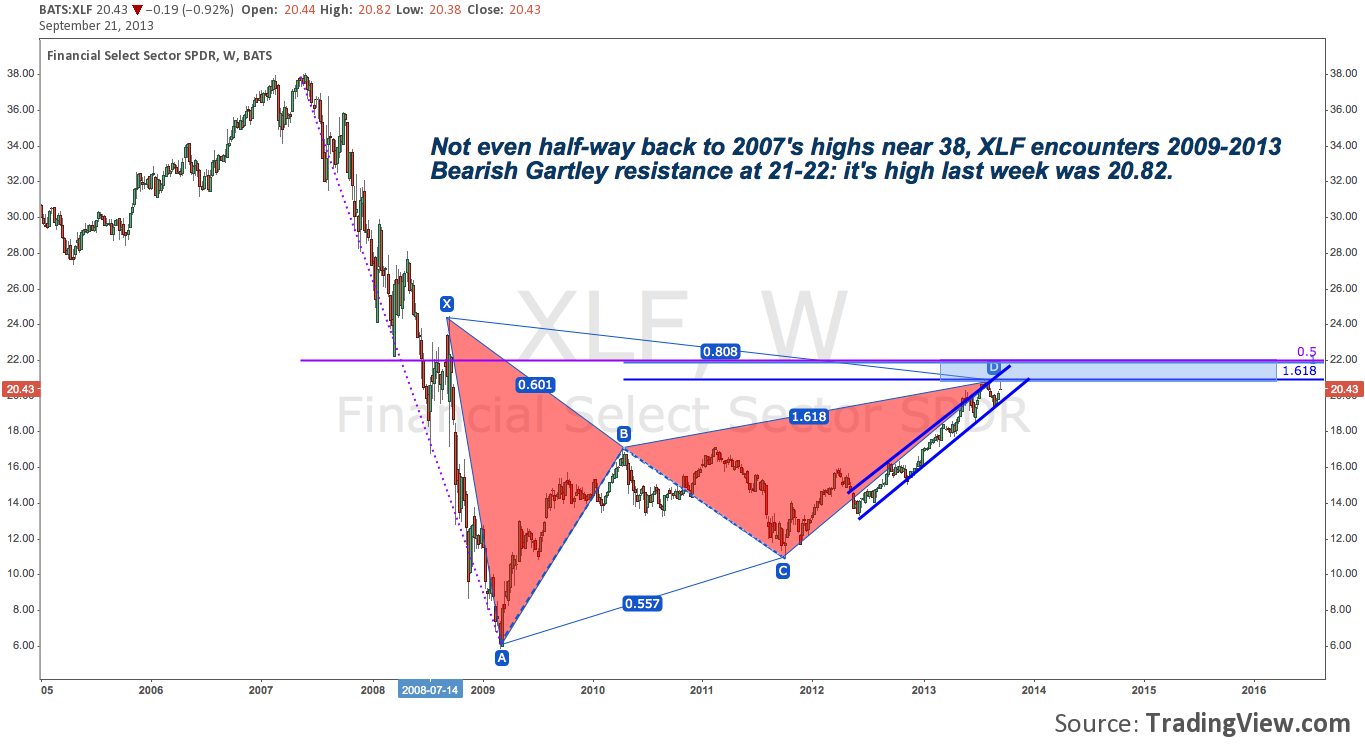
S&P 500 Sectors: Financials (XLF) – Daily
S&P 500 Sectors: Industrials (XLI) – Weekly
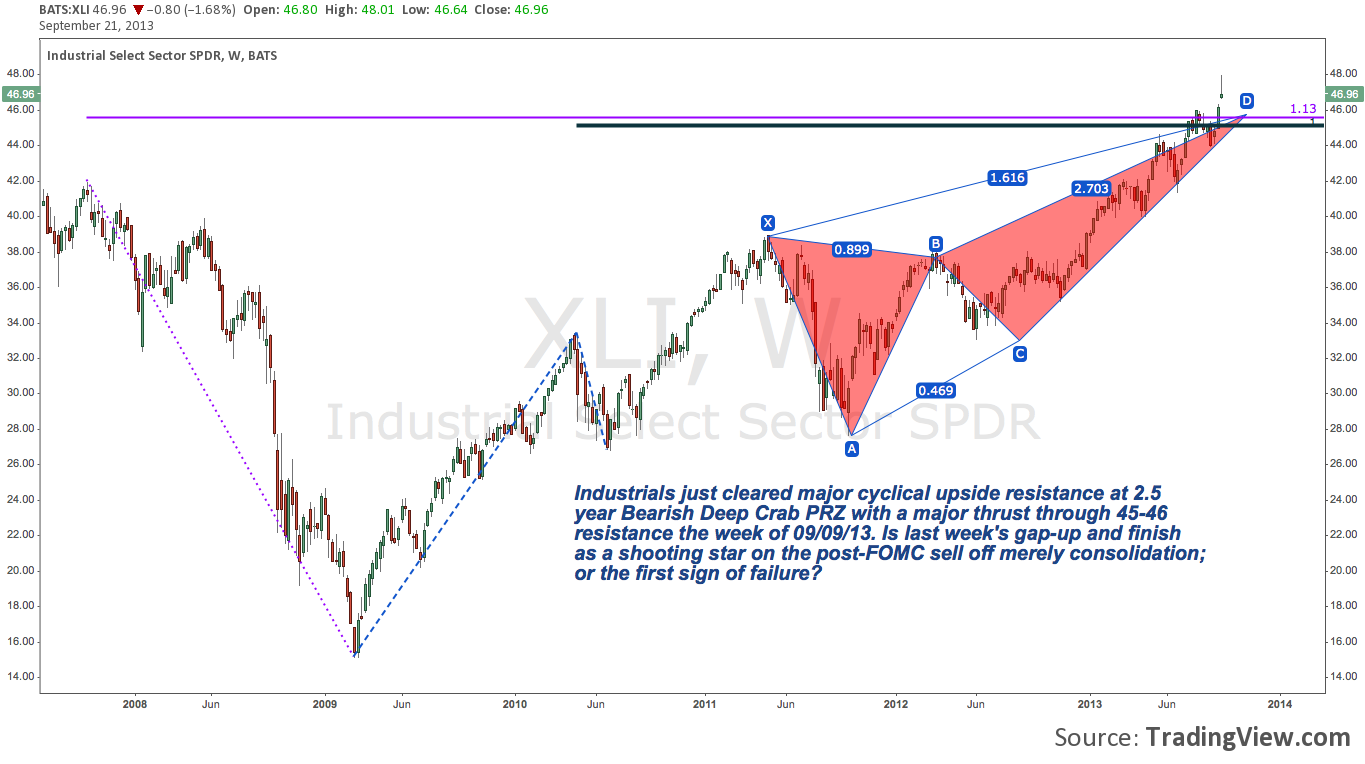
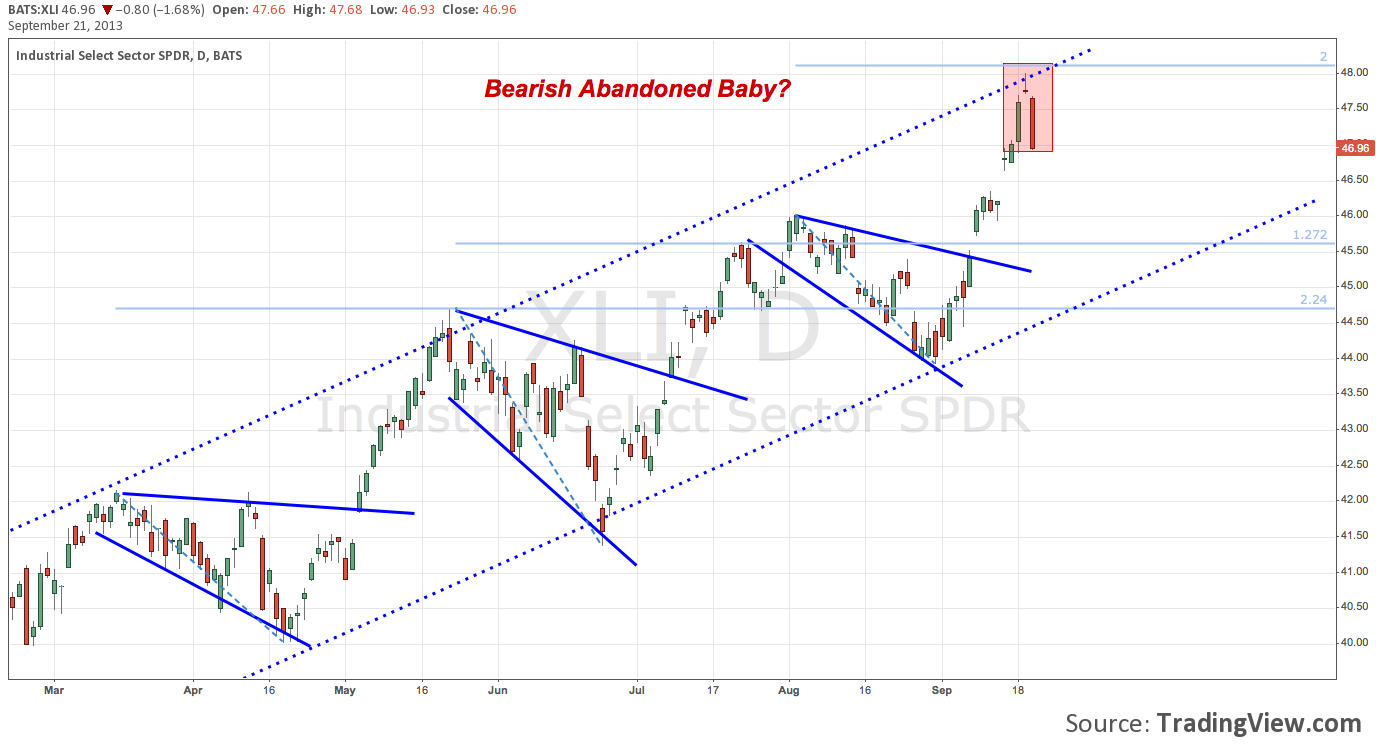
S&P 500 Sectors: Industrials (XLI) – Daily
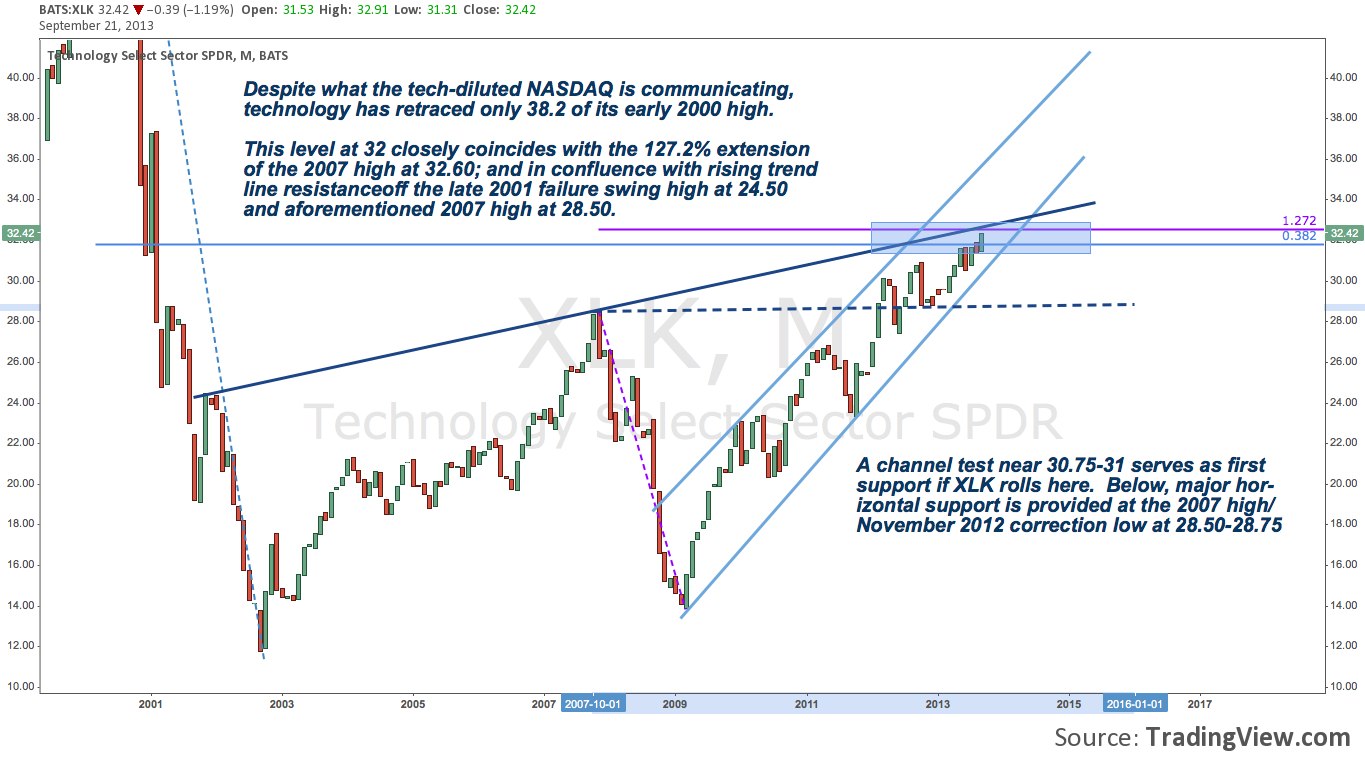
S&P 500 Sectors: Technology (XLK) – Monthly
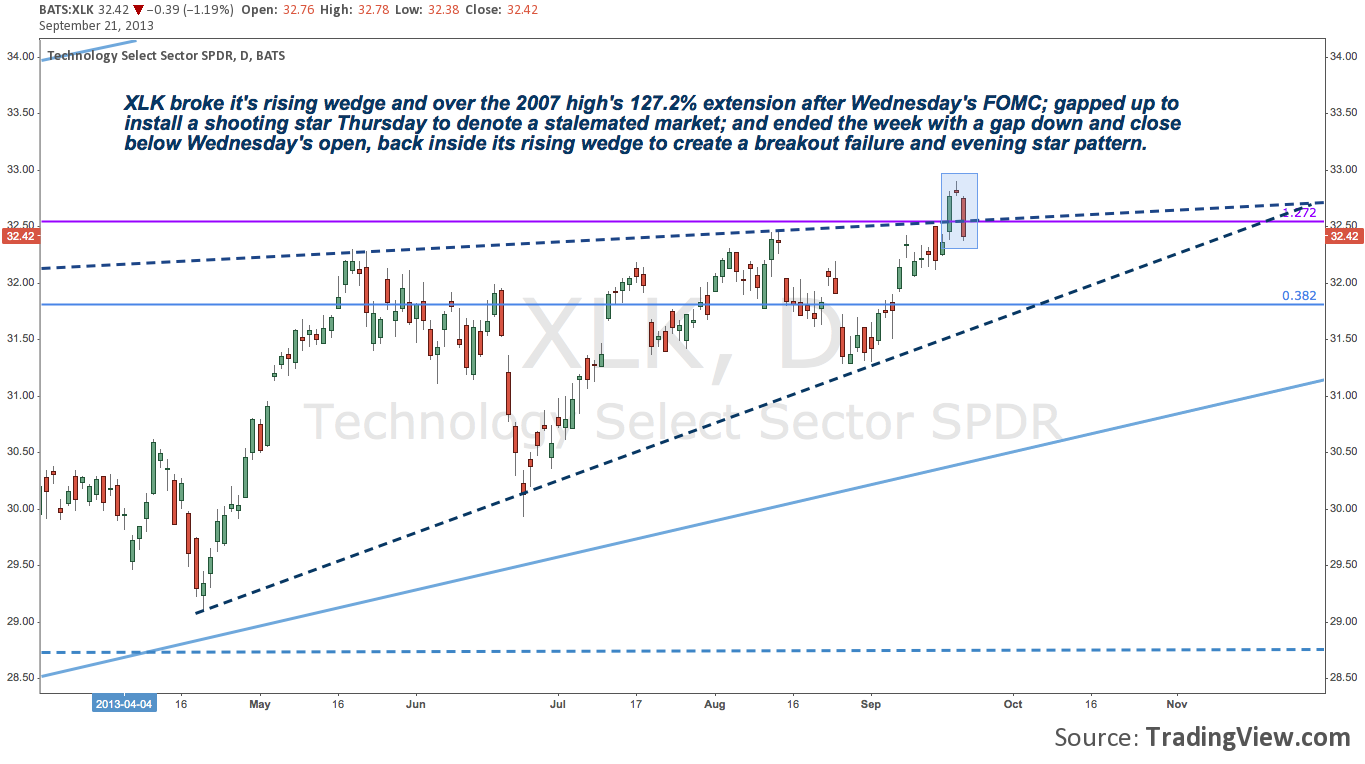
S&P 500 Sectors: Technology (XLK) – Daily
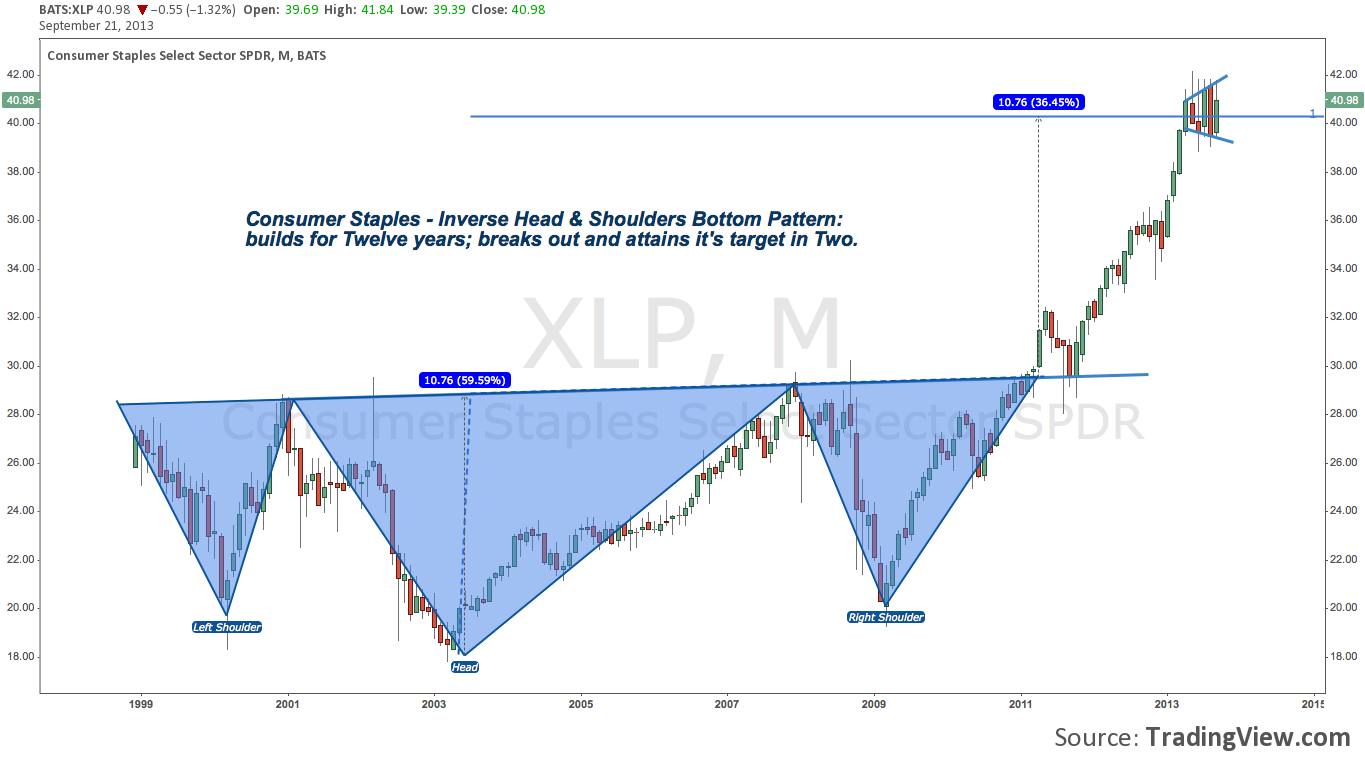
S&P 500 Sectors: Consumer Staples (XLP) – Monthly
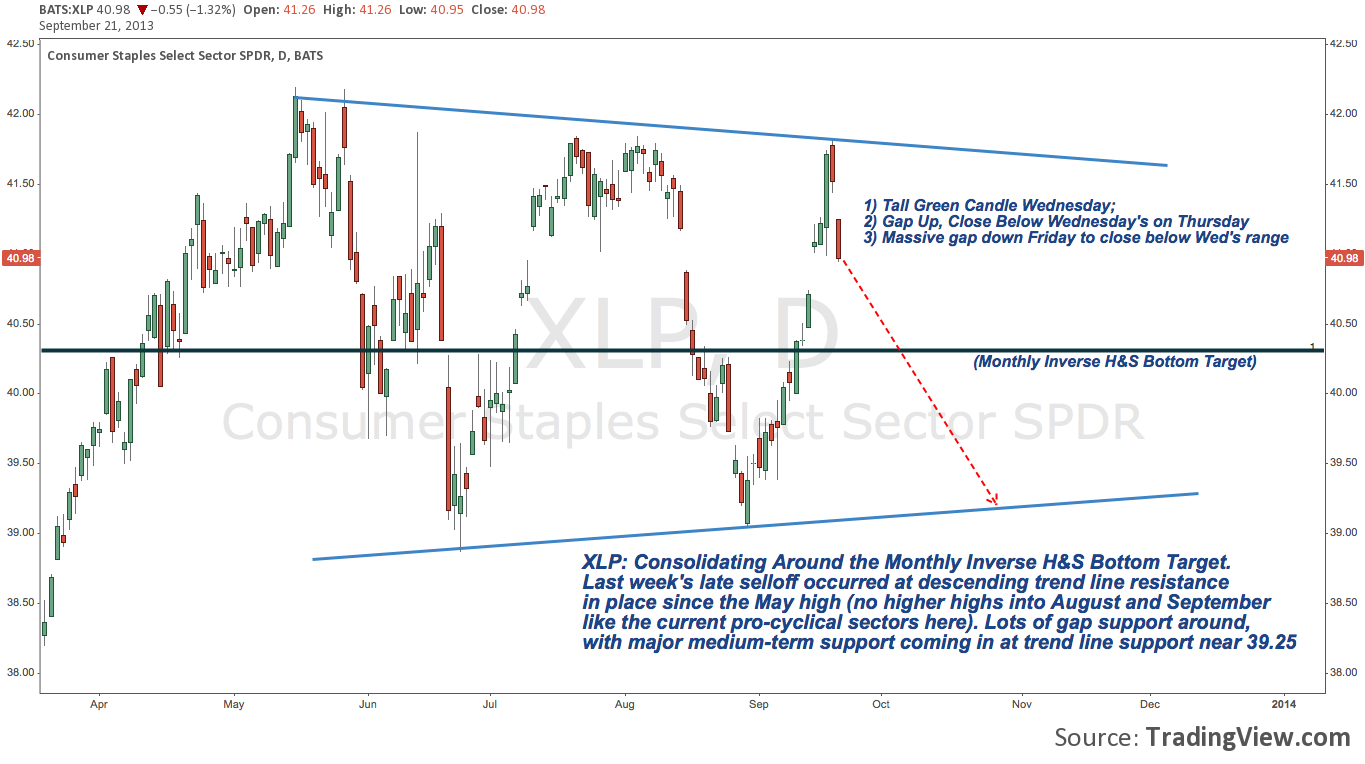
S&P 500 Sectors: Consumer Staples (XLP) – Daily
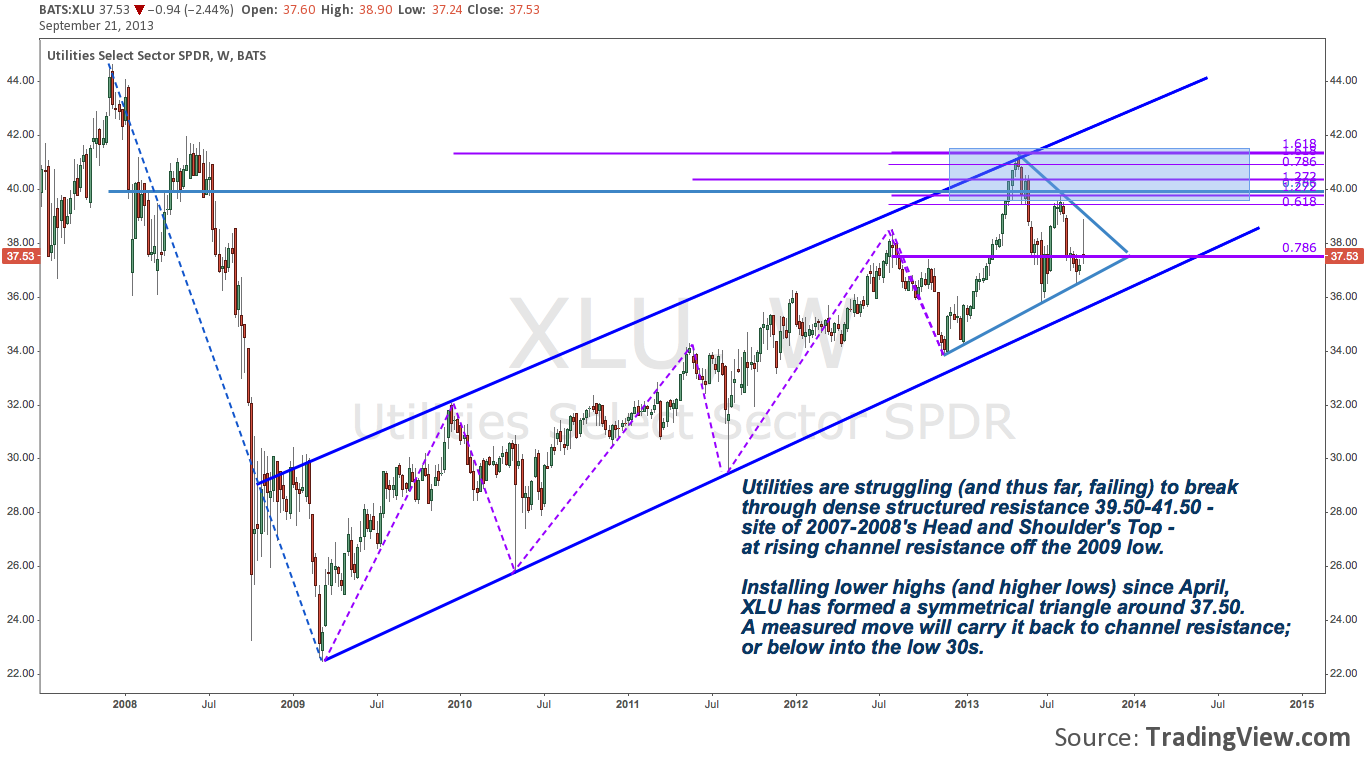
S&P 500 Sectors: Utilities (XLU) – Weekly
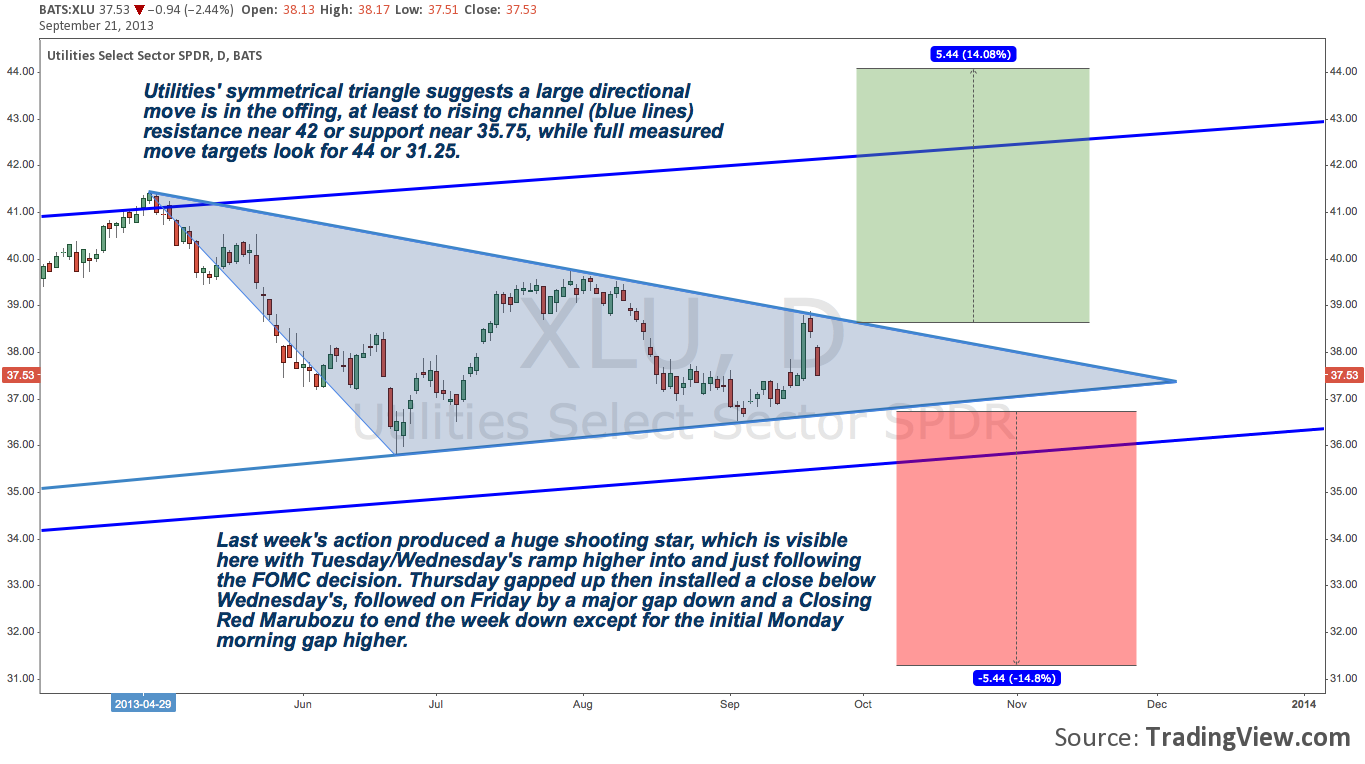
S&P 500 Sectors: Utilities (XLU) – Daily
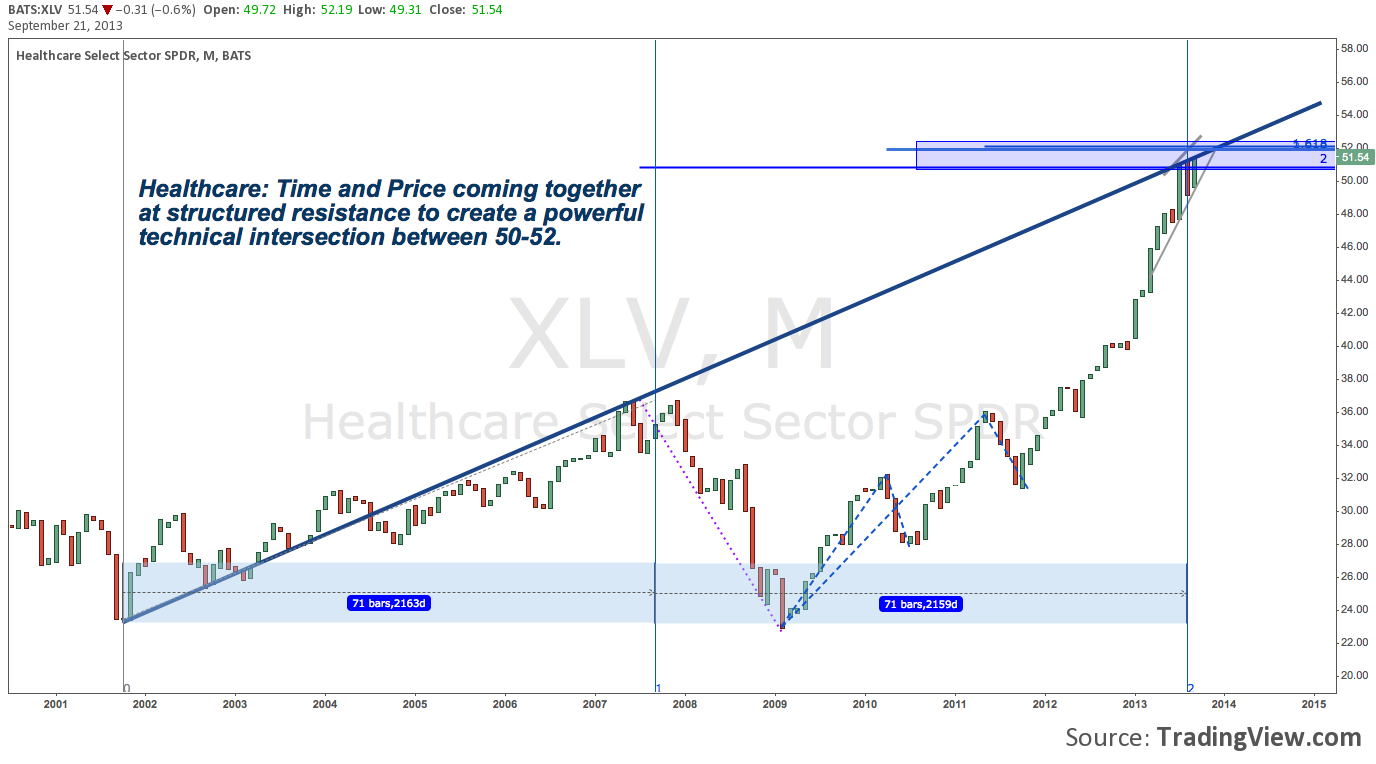
S&P 500 Sectors: Healthcare (XLV) – Monthly
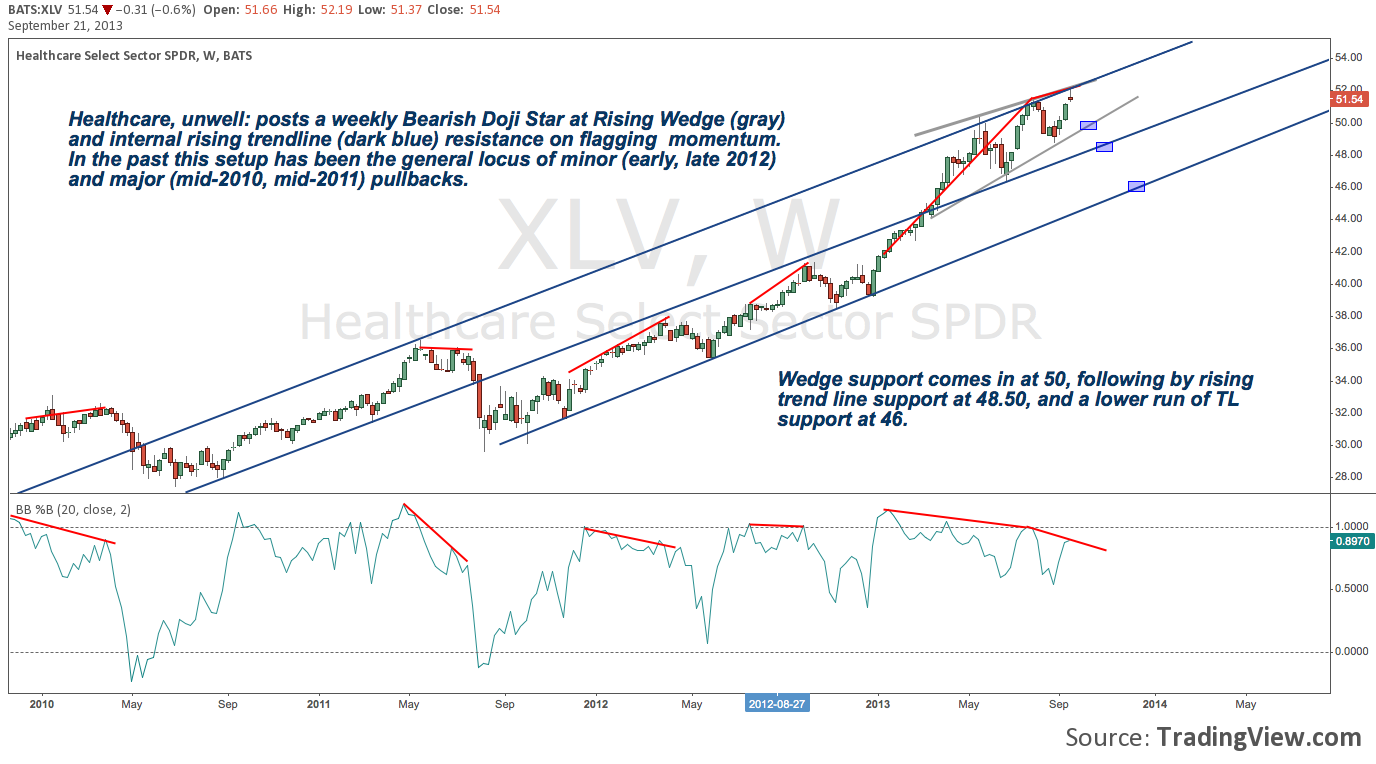
S&P 500 Sectors: Healthcare (XLV) – Weekly
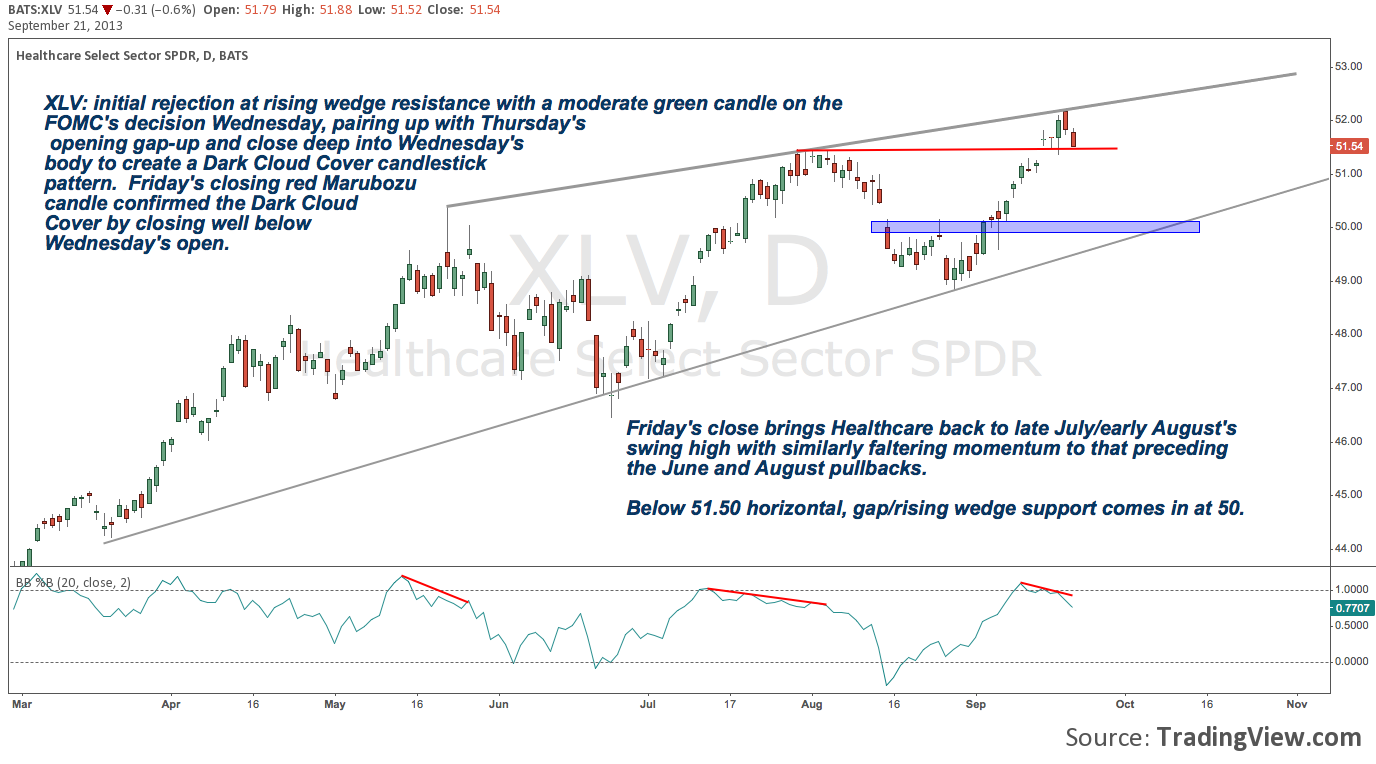
S&P 500 Sectors: Healthcare (XLV) – Daily
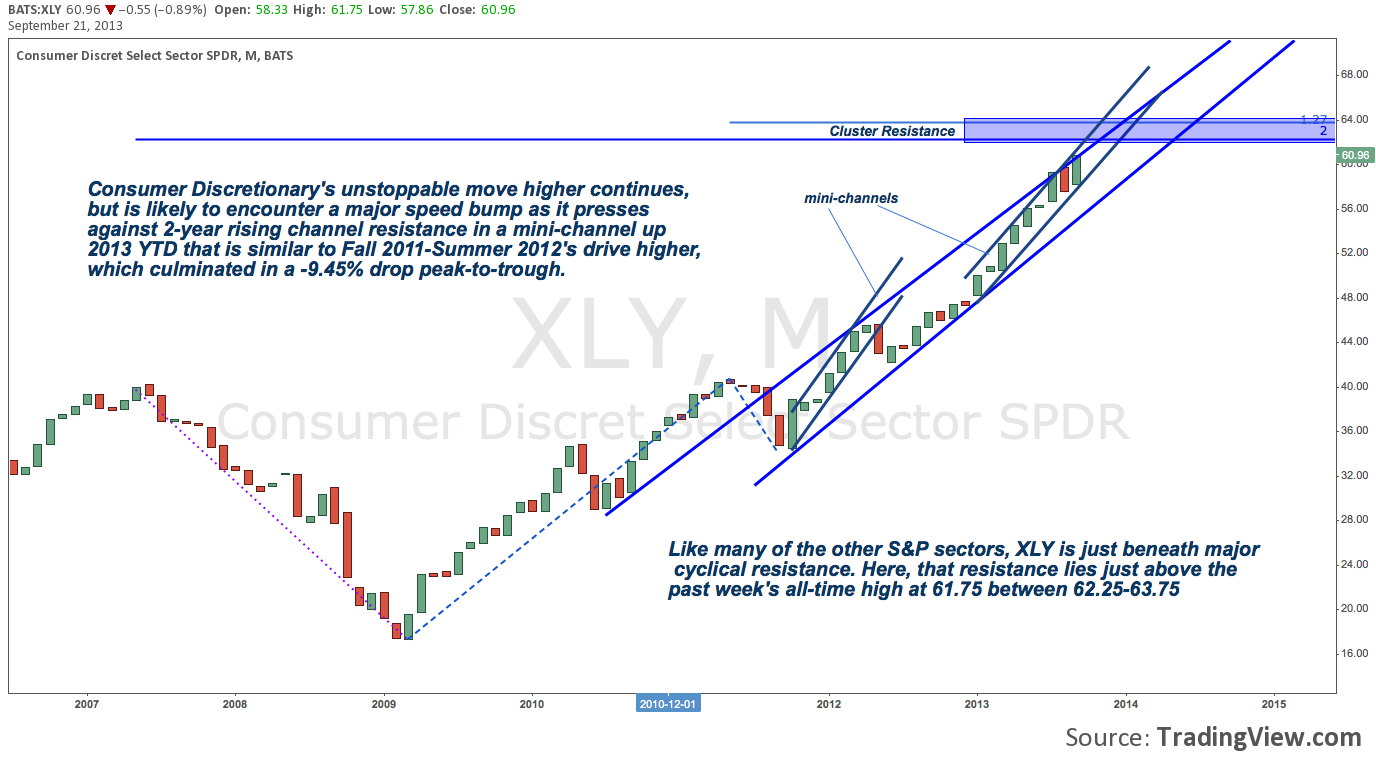
S&P 500 Sectors: Consumer Discretionary (XLY) – Monthly
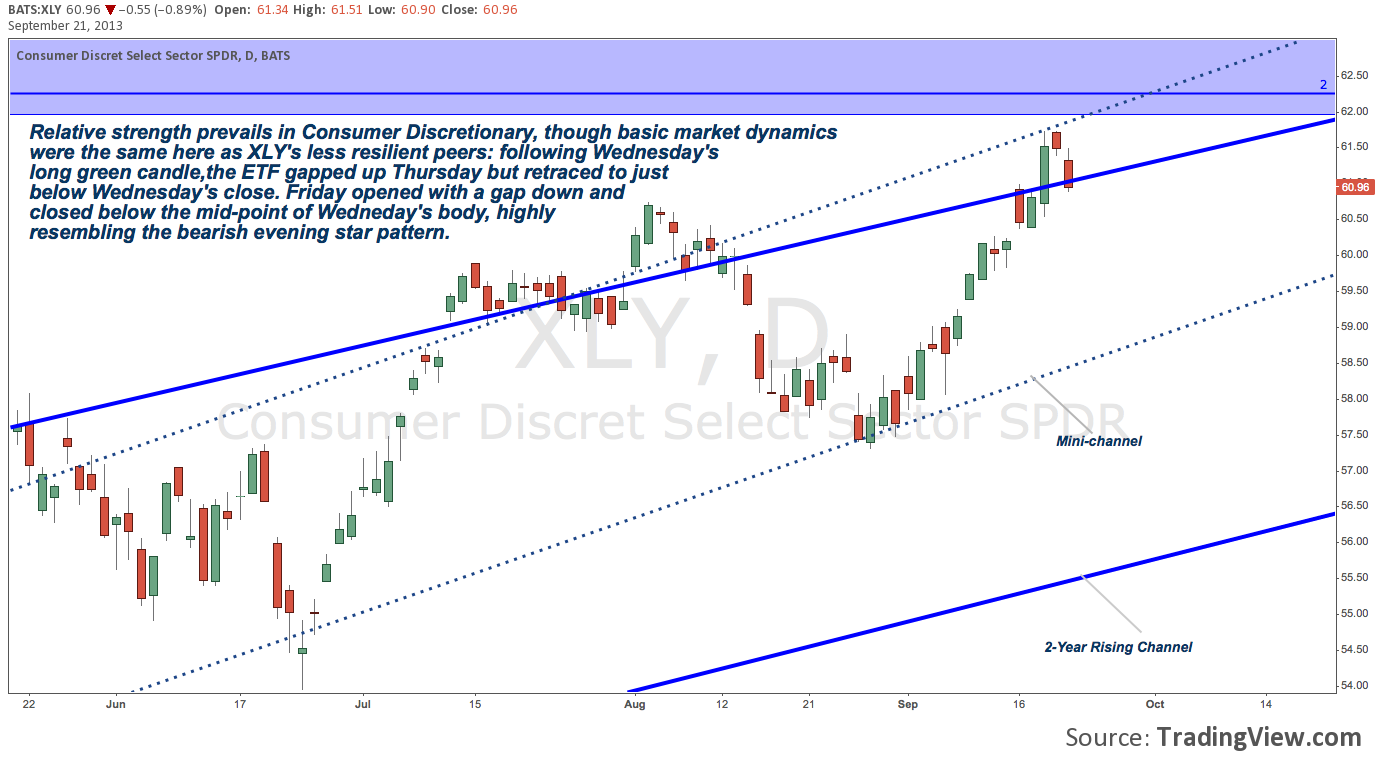
S&P 500 Sectors: Consumer Discretionary (XLY) – Daily
Twitter: @andrewunknown and @seeitmarket
Author holds no position in any securities mentioned at the time of publication.
Any opinions expressed herein are solely those of the author, and do not in any way represent the views or opinions of any other person or entity.
")


