The S&P 500 revisited and lapsed beneath December/January resistance near 1850 last Friday, briefly wobbling back into negative territory on the year before aggressively bouncing back into the green today.
See It Market’s Andy Nyquist points out the near-term significance of this trading level in a timely post at the end of last week: “1849 was a heavily watched support area. Yesterday [Thursday], it was taken out (bearish). The bulls would love to find a way to regain that level.” So far on the session Monday – whether because of passage of Crimea’s pro-annexation referendum, positioning ahead of Wednesday’s Fed decision or a few other plausible newsworthy alternatives – that is exactly what’s happened.
With today’s positive performance pushing broad equity measures to less than 2% off all-time highs, are stocks signaling “all clear” and poised to push into uncharted territory amid positive latter-March seasonality? Or is a lower high in the offing, tipping wary observers off to a deeper pullback? There are many ways to approach this question: here we’ll break down the S&P 500 (SPX) sector-by-sector with harmonic patterns to see what insights can be gleaned with a look under the hood.
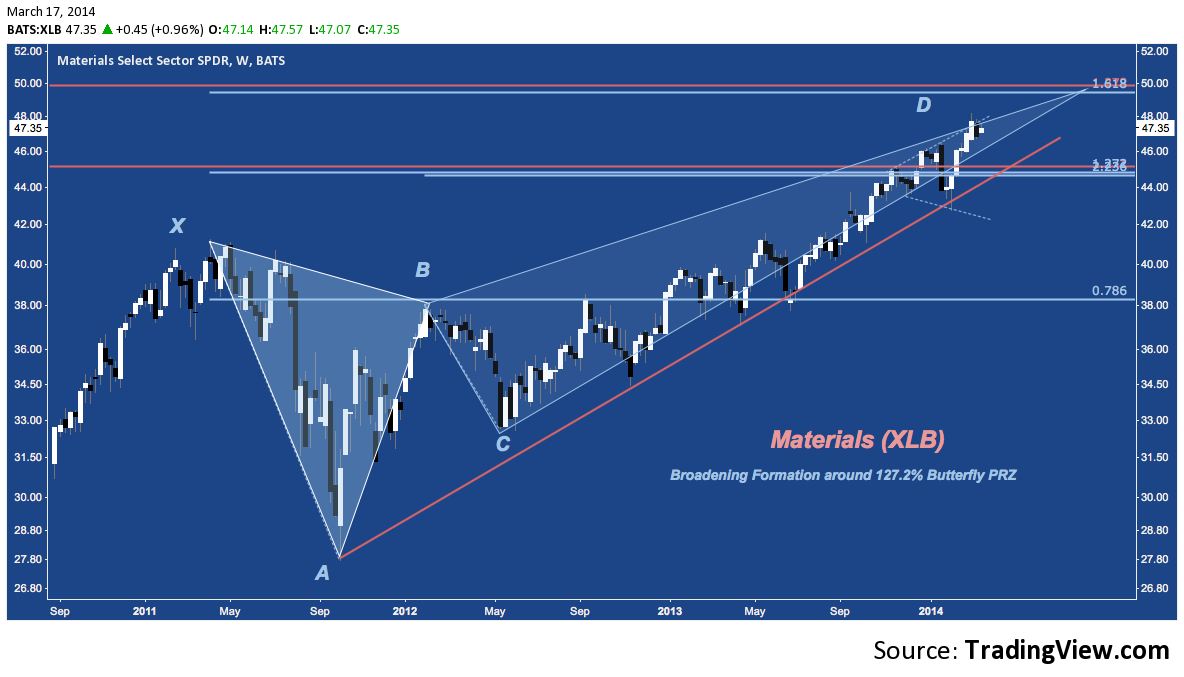
Materials (XLB) – Weekly
Materials continue to exhibit some impressive strength. With the sector between Bearish Butterfly potential reversal zones (PRZ) at 45 and 49.50, the path of last seems to be higher; but note that price is up against multi-month broadening formation resistance that could push the index back toward 45 and to rising trend line support in the coming weeks:
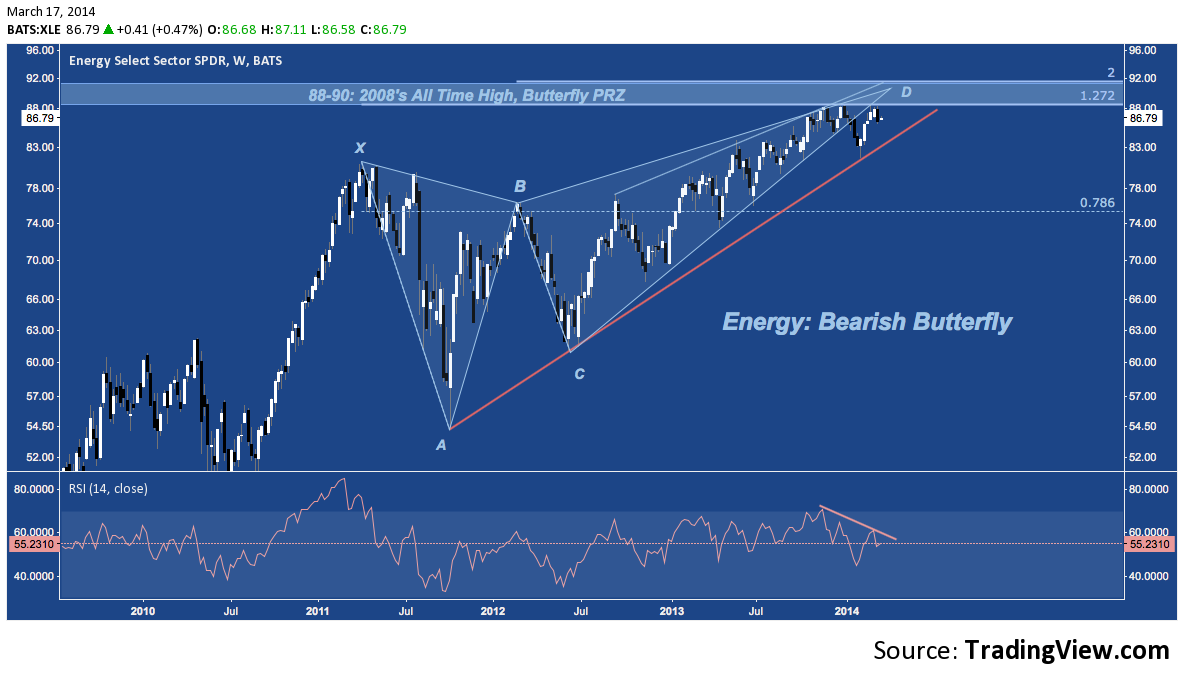
Energy (XLE) – Weekly
Like Materials, XLE is near a Bearish Butterfly PRZ – here around 90 (88-92), which coincides with 2008’s all-time high. Energy is negative YTD and has effectively gone nowhere for almost 6 months. It participated in the broad February rally with it’s peers, has paused at the long-familiar resistance near $88 on slackening momentum.
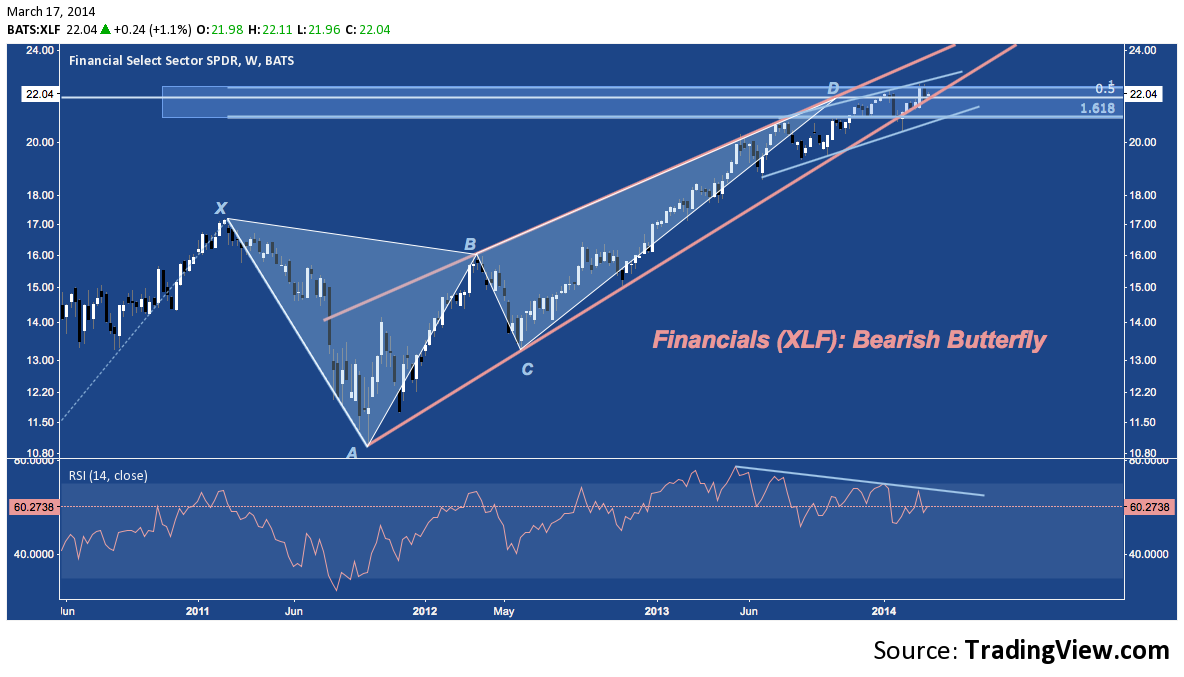
Financials (XLF) – Weekly
Financials, too, are at multi-year Bearish Butterfly resistance (notice the theme?) between 21-22.50: an area it has been struggling with for several months, echoing fellow laggard XLE‘s congestion. XLF‘s 9-month rising channel has development on a negative momentum divergence (visible on RSI, lower panel). Is momentum simply resetting after 2012-early 2013’s strong performance before breaking higher; or is this divergence near the sector’s 2.5 year rising wedge apex signaling exhaustion?
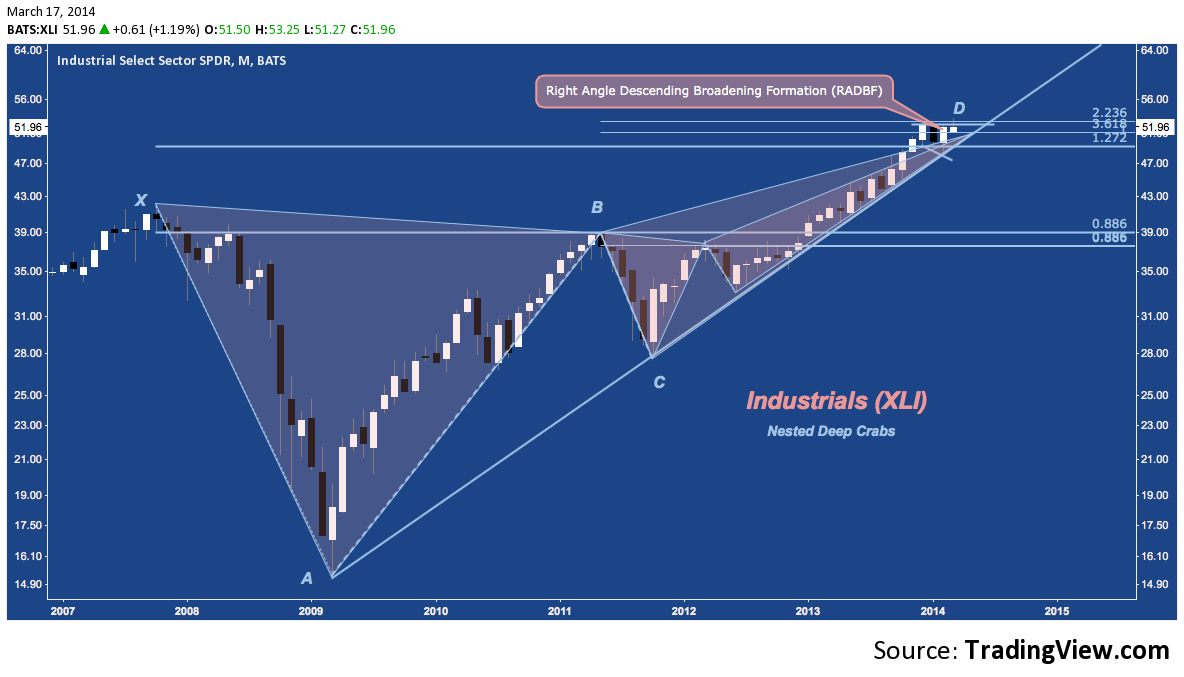
Industrials (XLI) – Monthly
Industrials are characterized by a different 5-point harmonic pattern – two, actually – known as a Deep Crab. Both formations – the smaller building out the right arm of the larger – culminate in PRZs near $52. Acknowledging this, XLI has been consolidating in a Right Angle Descending Broadening Formation (RADBF). After a failed breakout early in March, the sector is back inside the pattern, above rising trend line support off the 2009 low, but struggling to generate decisive positive momentum to break its congestion.
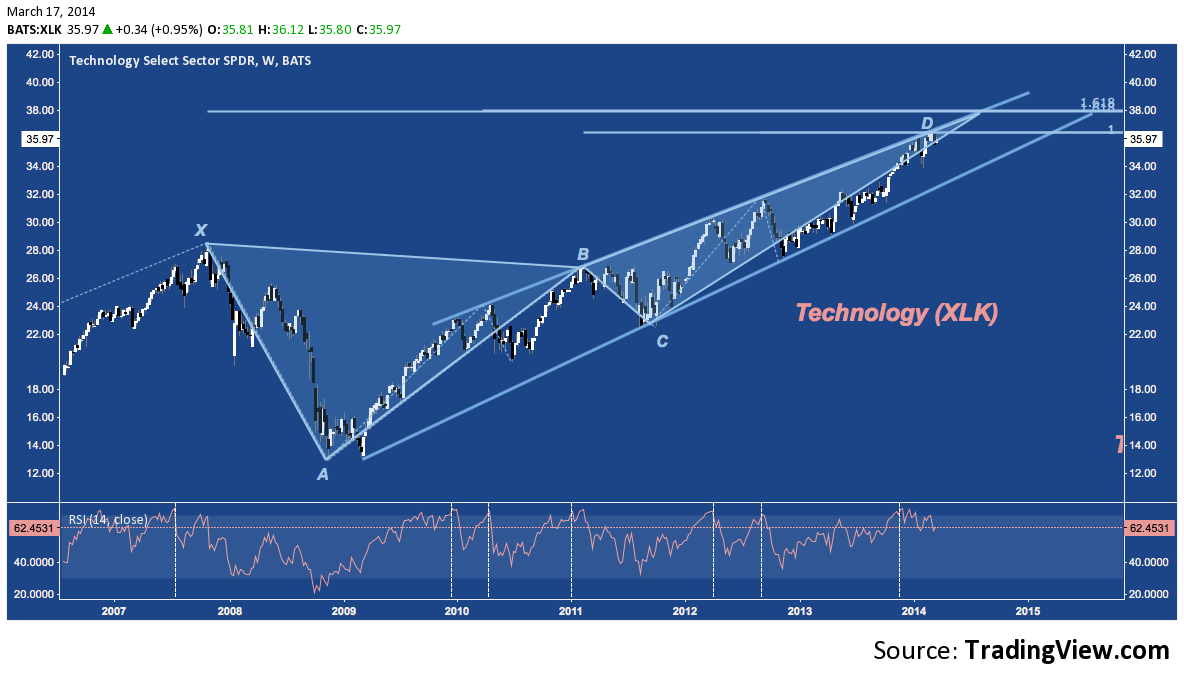
Technology (XLK) – Weekly
Technology finds itself at Deep Crab PRZ resistance as well: along with rising channel resistance and on diverging momentum following an overbought reading that has unanimously signaled pullback/correction over the life its the pattern.
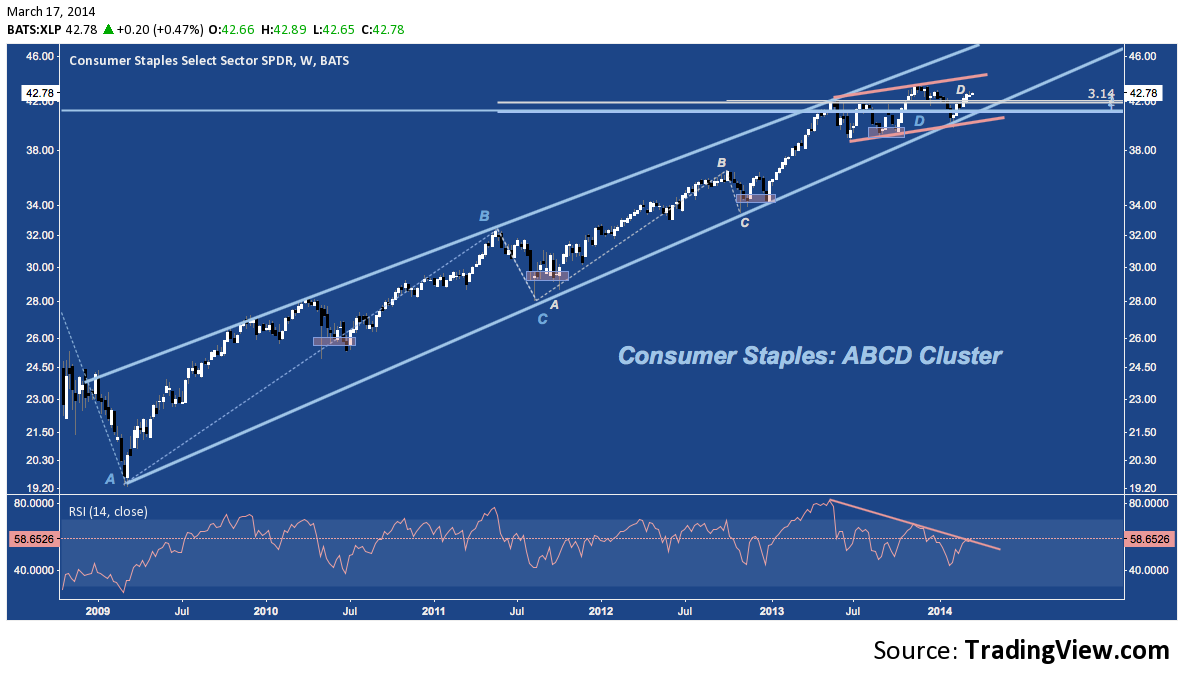
Consumer Staples (XLP) – Weekly
XLP is moving through a lateral/modest rising channel (orange) at ABCD cluster resistance near 42-44; also on negatively diverging momentum. Larger rising channel resistance (blue) is now almost 10% higher.
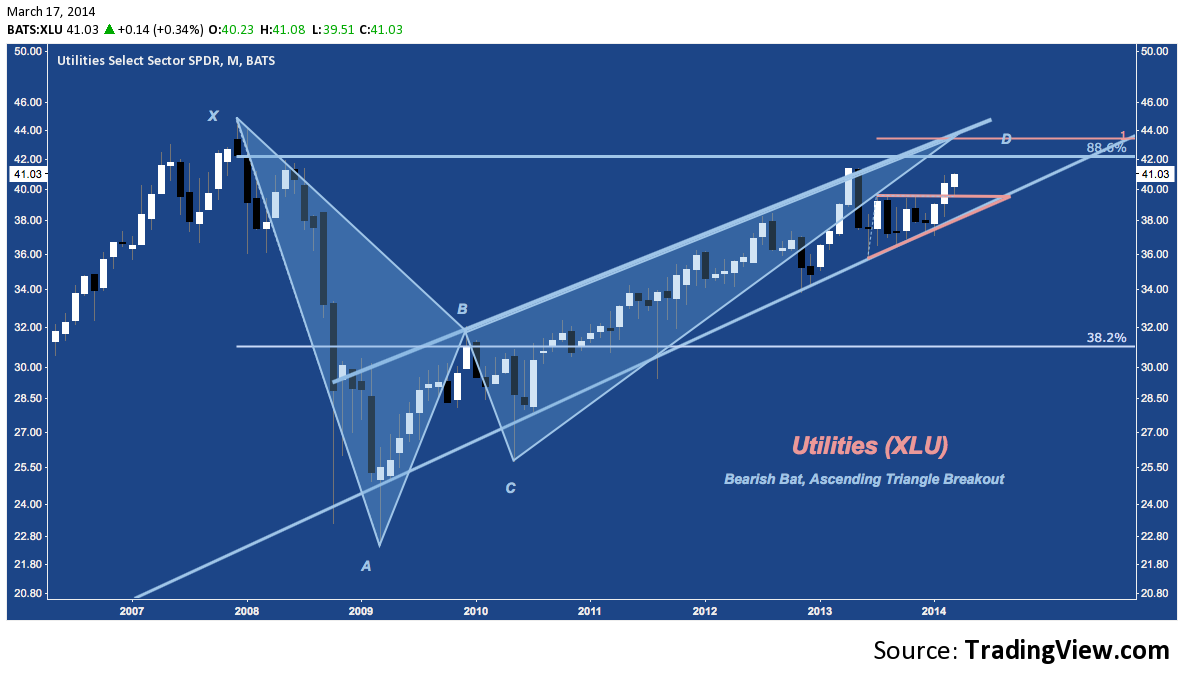
Utilities (XLU) – Monthly
Utilities are a bright spot in the S&P over the past few weeks – a simple and disconcerting testament to rarefied market environment we find ourselves in here. Breaking from ascending triangle resistance last month, XLU tested the breakout level near $39.50 in early March but bounced higher. The sector’s 6-year Bearish Bat harmonic pattern PRZ is just above between $42-$44.
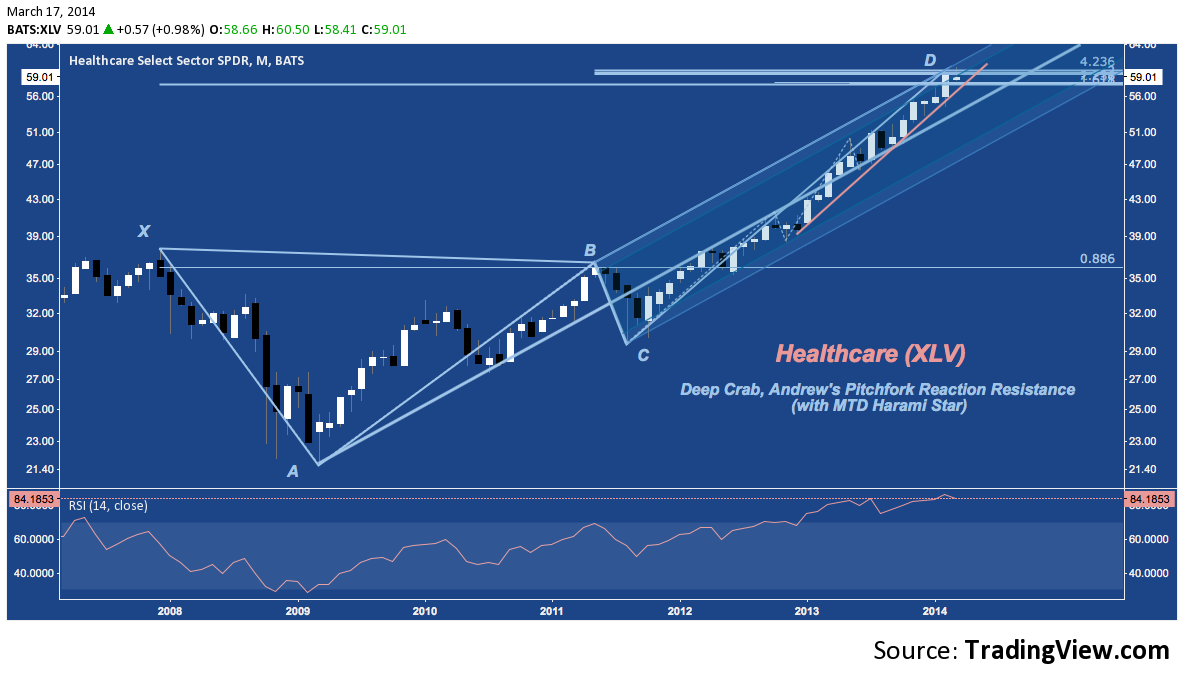
Healthcare (XLV) – Monthly
The Healthcare sector – dominated by a bubbly Biotechnology industry – is at Deep Crab PRZ and Andrew’s Pitchfork (APF) reaction line resistance with a monthly RSI summiting at a staggering, oxygen-deprived 84. If Biotech ETF IBB‘s equally exospheric constituents disappoint the impossibly optimistic appraisal the entire industry has been blanketed with, XLV is likely to fall: first to the APF midline near $55-$56, with major horizontal support further down at $50-$51.
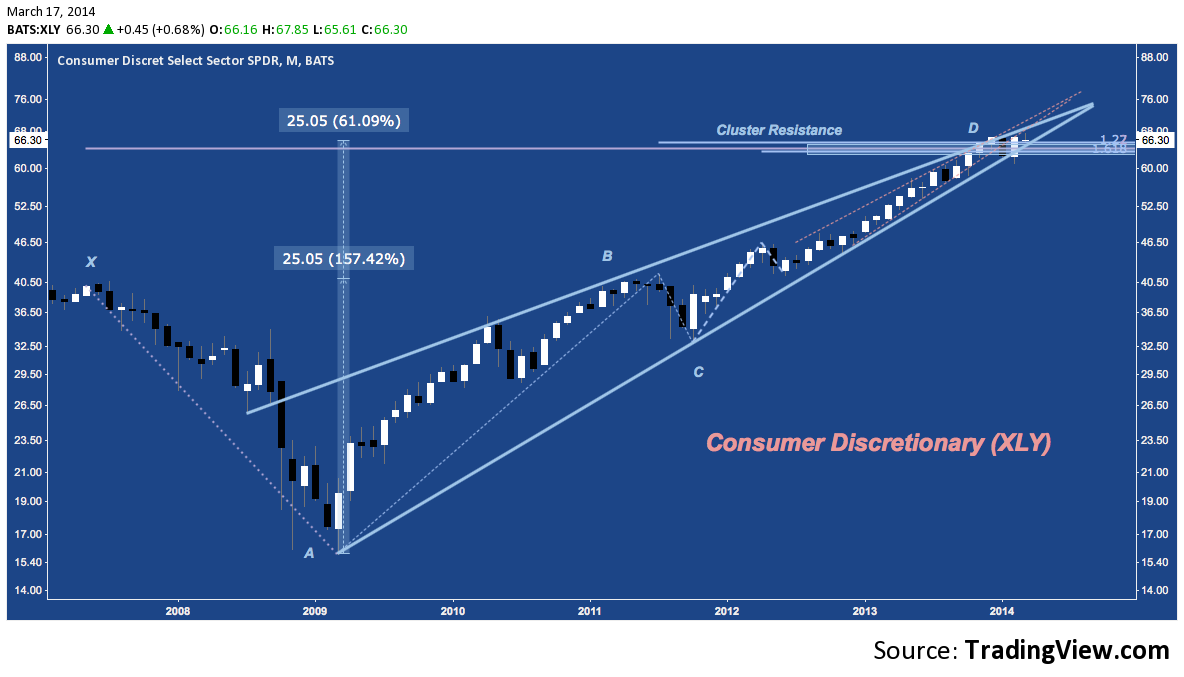
Consumer Discretionary (XLY) – Monthly
After completing a 200% extension of 2007-2009’s range (line XA) near $65-$66 in November, XLY has gone nowhere, congestion near the apex of it’s 5-year rising wedge at ABCD and cluster resistance.
The same question lurks in each of these chart: is sideways movement over the past several months simply a consolidation basing for renewed move up? Or do the completion of so many measured moves, the presence of major concentrations of fibonacci resistance built up over multiple years, the culmination of rising wedges here and moves to channel resistance there on flagging momentum add up to an imminent correction?
Until these technical hurdles are decisively overcome, traders and active investors should keep in mind the (in some cases, very) limited upside they suggest the market has left before taking a noteworthy turn lower.
Twitter: @andrewunknown and @seeitmarket
Author holds no exposure to instruments mentioned at the time of publication. Commentary provided is for educational purposes only and in no way constitutes trading or investment advice.
Any opinions expressed herein are solely those of the author, and do not in any way represent the views or opinions of any other person or entity.

 Rolling Over At Key Fibonacci Level?")


