The S&P 500 declined for the third consecutive month, falling -0.41% in February. This marks the first three month losing streak for the index since 2011 and hints at a potential change in character for the stock market.
The index declined two consecutive months in 2015, 2014, and 2012, and in each instance an S&P 500 reversal saw the index explode to the upside during the third calendar month to avoid a three month losing streak. That wasn’t the case this go around – at least from a timing perspective, this time actually was different. February’s red close marks just the sixth instance since 1950 in which the S&P 500 declined in December, January, and February. I’d be remiss in not mentioning the last time the index declined December through February was 2008…
For the second consecutive month the S&P 500 barely spent any time in the black. February didn’t close a trading session in positive territory for the month until February 22nd. By month end, the index closed just three trading sessions above January’s close at 1,940.24 and drew up just 1.17%, well below February’s historical average drawup of 2.68%. This follows January’s weak performance where the index finished zero trading days higher than December’s close. To say it’s been a weak start to the year for stocks is an understatement. The Bulls dug themselves a massive hole, but…
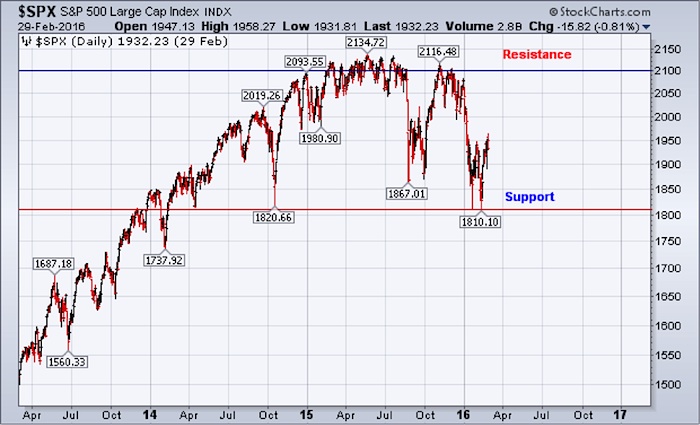
February saw the Bulls make a major comeback, though, for the second consecutive month. A delayed, yet timely, S&P 500 reversal took hold and helped the index finish 6.74% off its low (1,810.10) and once again appear to have held critical support on the daily, weekly, and monthly charts. Every single participant will now note the clear double bottom chart formation in place for the index. The primary trend isn’t down, or up, it’s sideways or trendless.
Stocks are not in a definitive Bull Market, nor a Bear Market. The stock market is stuck in neutral idling, deciding whether we’re headed to “drive” or “reverse” next. Critical support lies at ~1,810, critical resistance sits at ~2,100. Trading ranges are notoriously difficult to forecast as there is no hint of directional certainty until after price trades decisively below critical support, or above critical resistance. Predicting the breakout is often an exercise in futility, the key is to identify the breakout shortly after its arrival.
As we look to the month ahead, March is historically “bullish” for stocks. Since 1950, March is 43-22 for average returns of 1.17%. However, when January and February are negative March actually strengthens, rising 1.67% on average. March’s average drawup and drawdown relative to February’s close is 3.60% and -2.52% respectively. This would target a monthly range between ~1,883 and ~2,000. Should we trade toward the upper end of the range and perhaps beyond, this would coincide with a test of our 100 and 200-day simple moving averages and our 12-month simple moving average.
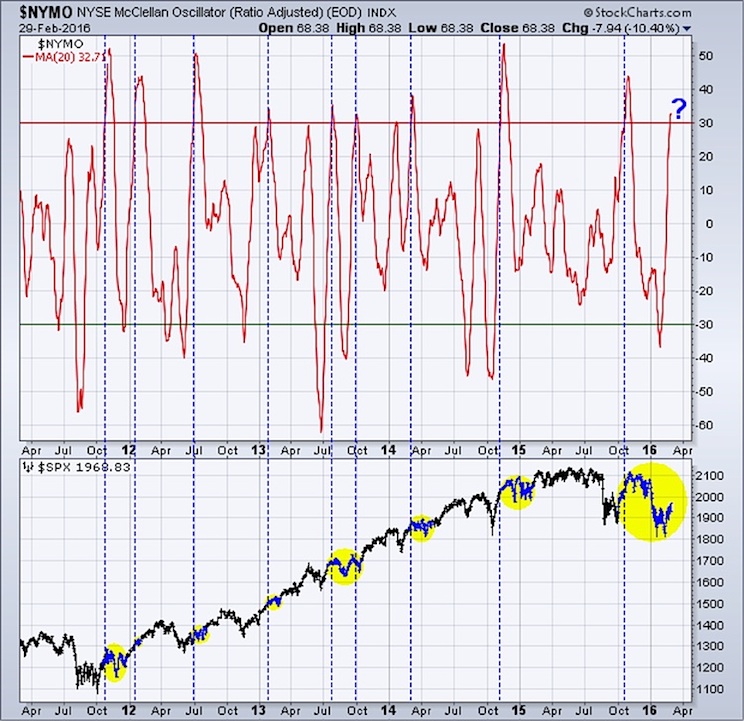
While the price action at and around these levels would be must see TV, it would still represent more chop and slop, rather than range expansion above 2,100 or below 1,810. Ironically, the 20-day simple moving average of the NYSE McClellan Oscillator (20MCO) suggests more chop is to be expected. During the last five years, the most bullish portion of the market cycle, every time the 20MCO priced beyond 30 the S&P 500 tends to trade sideways for a month or more. There’s often further advances, but they’re generally unsustainable.
The Bottomline: The S&P 500 reversal, though timely, has simply helped to define a broader trading range. Therefore, the stock market remains trendless. The game plan during trendless environments is to buy the dips and sell the rips. Opportunistic and skilled traders have thrived, while investors have made virtually no progress the last two years.
As we head into March, there’s a clear tailwind behind the S&P 500, therefore I’m looking for a positive monthly close with additional chop. March and April close out the “favorable” period for the S&P 500, and since the “favorable” period has already been rather disastrous, I’d caution against being overly bearish the coming two months. As we move into May and beyond, that’s when I’ll start looking in the closet for my Bear suit.
Thanks for reading.
Further reading from Steve: “What January Says About Stock Market Returns In 2016“
Twitter: @SJD10304
Any opinions expressed herein are solely those of the author, and do not in any way represent the views or opinions of any other person or entity.

 Rolling Over At Key Fibonacci Level?")


