U.S. stock market indices rose yet again last week with the S&P 500 Index (INDEXSP:.INX) setting a new all-time record high on Friday. The S&P 500 is attempting to record its 5th straight week of gains this week.
Stocks have been supported by better-than-expected second-quarter earnings and an improved outlook for U.S. manufacturing. Stocks enter the new week with several hurdles to overcome which raise the prospects for a period of consolidation/correction before the bullish trend continues.
Despite second-quarter earnings beating expectations, it is estimated that profits for the S&P 500 overall will be down for the 5th consecutive quarter by more than 4.0%. More importantly, the consensus estimate is for third-quarter earnings to be flat. The Federal Reserve convenes this week with expectations for a rate hike at zero probability. Nevertheless, with the economy on the mend, inflation pressures edging higher and stocks at new record highs, it would not be surprising if Fed Chief Janet Yellen raised the likelihood of a rate hike sooner than most anticipate. Additionally, stocks are technically overbought and with September the weakest month of the year historically for stocks coming into view, a cautious approach near term now is suggested.
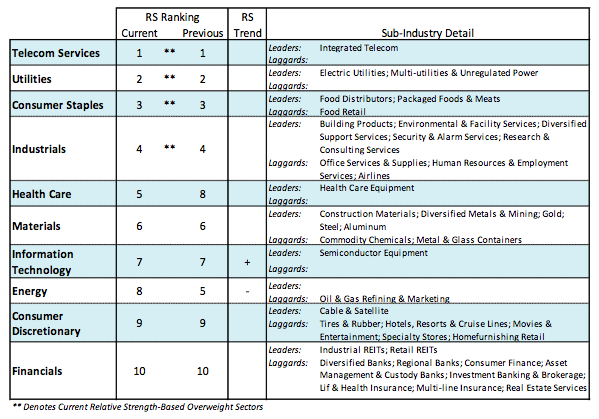
The technical condition of the market continues to argue that the longer-term prospects for the stock market are for higher prices. The broad market continues to gain strength as seen in the new record high by the NYSE Advance/Decline Line. This is important because the broad market typically leads the popular averages by several months. A further testament to the strength of the broad market is that for the first time in nearly a year more than 73% of the industry groups within the S&P 500 are in uptrends. Additionally, the number of stocks making new highs is not yet back to the levels seen in 2013, but it is expanding and the number of issues making new lows continues to drop.
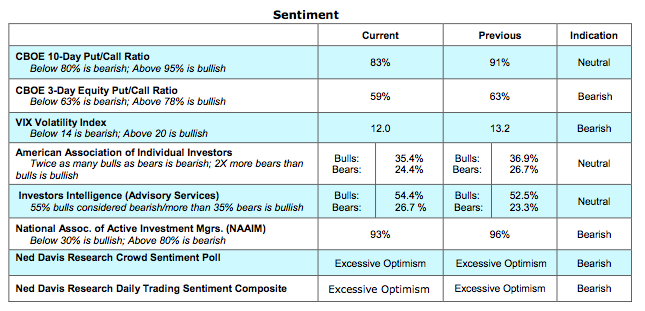
Investor sentiment, that has been cautious and skeptical this year, has turned more optimistic. This can be found in the latest data from the National Association of Active Managers (NAAIM) that shows for the second week in a row an allocation toward stocks of more than 90%. This starkly contrasts with a 23% allocation to stocks just prior to the February/March rally. The extreme optimism found in the NAAIM data, however, is not confirmed by the latest numbers from Investors Intelligence or the American Association of Individual Investors. Considering the strong breadth and momentum we are likely to witness more widespread optimism before an important peak in stock prices can be anticipated.
Thanks for reading.
Twitter: @WillieDelwiche
Any opinions expressed herein are solely those of the author, and do not in any way represent the views or opinions of any other person or entity.


