All things considered, the major equity indices put up some respectable numbers in May: the S&P 500 (SPX) managed to tack on 1 percent while the Russell 2000 (RUT) and Nasdaq Composite (COMPQ) posted +2.1 percent and +2.6 percent respectively.
Looking at the overall price structure of the market it is still difficult to be bearish. The above three indices are in clear broad market uptrends and the worst that can be said is that they remain confined within their respective consolidation patterns.
In my prior market outlook, I talked about how the price structure of the S&P 500 seemed to be morphing from a bearish rising wedge to a bullish ascending triangle.
Fast forward two weeks and one can still make the same argument. However, the truth is that the bulls had ample time and opportunity to push the S&P 500 toward 2150, yet failed to deliver.
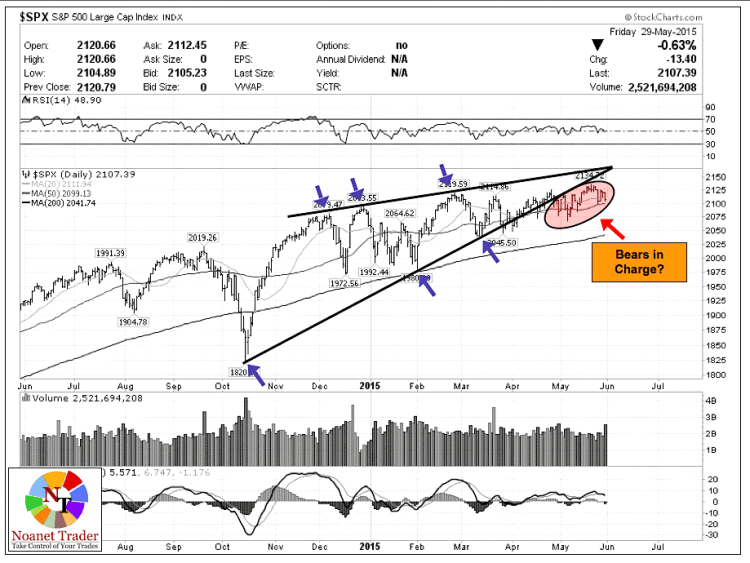
This failure validates and reinforces the eight-month rising wedge: The S&P 500’s price action in May can be summed up as a bearish consolidation beneath the wedge’s lower trendline (see chart below). This will need to be monitored into June.
S&P 500 CHART – Bearish Rising Wedge?
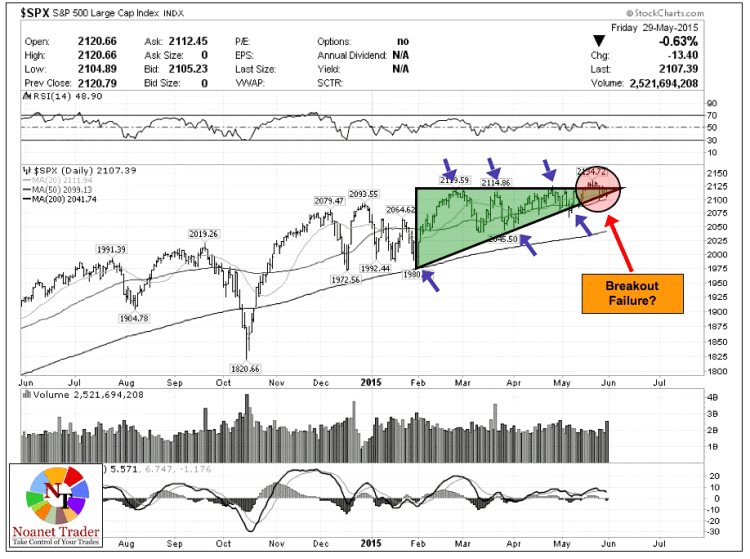
Switching to the bullish ascending triangle view, the overall pattern remains intact but the bulls seem to have squandered a good breakout opportunity: the S&P 500’s attempt to push through 2130-2135 was rejected and the index ended the month resting at the lower trendline of the pattern.
S&P 500 – Bullish Ascending Triangle: A Failed Breakout?
Should the S&P 500 now fail to stay above the 2090-2100 area, the proper label for this price action would be “Breakout Failure” in my opinion. And further, this would make the overall price structure much less bullish.
Adding to the bulls’ problems is the weakness within the Dow Jones family.
There has been a raging debate about what the recent relative weakness in the Dow Jones Transportation Average means.
Dow theorists interpret this sort of a divergence as unequivocally bearish, while many bullishly-inclined analysts continue to “pooh-pooh” the whole concept as meaningless and yet another instance of desperate bears grasping at straws while the market keeps going higher.
I personally have no clue what the transports are trying to tell us, but think it is foolish of bulls to dismiss it or be in denial, especially since the weakness, far from remaining isolated to this sector, seems to be spreading to industrials and other sectors.
On Friday, the Dow Composite index had its first close under the 200 day moving average since last October, while the Dow Jones Industrial Average closed under their 50 day moving average.
Notwithstanding all of the above, I am still having a hard time joining the bear camp.
For me personally, identifying market tops is easiest when everyone is complacent, giddy with greed and excitement, and talking heads on CNBC are pounding the table about the Nasdaq going to 10,000 this year or something equally ludicrous.
Right now, market sentiment is far from bullish and there is a lot of negativity about the multitude of fundamental and technical headwinds facing the market. Put another way, the proverbial “wall of worry” is still alive and well.
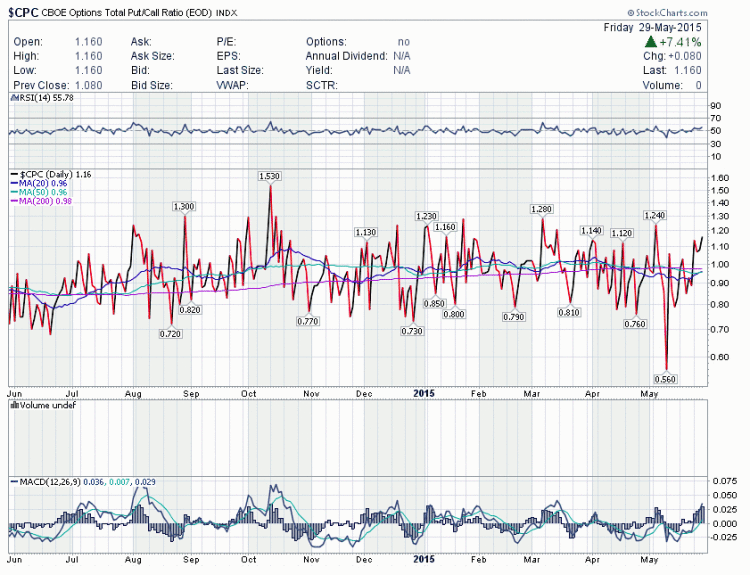
This sentiment is reflected in the relatively high total put/call ratio (see below). As many of you know, put/call ratio is a contrarian indicator and, in the 1.15-1.20 area, it corresponds better with short-term market bottoms rather than tops.
CBOE Options Total Put-Call Chart
As we head into June it is fair to say I feel “dazed and confused” – it is impossible for me to be comfortably bullish in the absence of strong price action. However, it is just as hard for me to be bearish when the sentiment seems so dour.
This leaves me with only one sensible course of action and that is to wait for the market to tell us what it wants to do.
Thanks for reading!
Twitter: @NoanetTrader
Read more from Drasko on his blog NoanetTrader.
No position in any of the mentioned securities at the time of publication. Any opinions expressed herein are solely those of the author, and do not in any way represent the views or opinions of any other person or entity.


