Stock Market Futures Outlook for May 27, 2016 – Buyers continue to hold firm into a long U.S. holiday weekend. The move upward on S&P 500 futures has been congested as suspected up here, but as the chart holds a base, we are likely to test the edges of resistance near 2095 -2097.
The chart could expand, but it’s likely to fade upon initial testing. The key remains to watch for a higher low to develop after the spike upward – or for a lower high under divergence to signal potential downside movement.
Momentum on the four-hour chart of S&P 500 futures remains bullish, but flattening in trending spaces. Buyers are set to defend the support regions near 2080.5 -2082, and resistance looms above at 2095-2097. Buyers and sellers are landlocked in the struggle, so we’ll be looking at the range above or the range below to give way. If we can hold above important breach levels of 2075, and that keeps buyers in control, in general. Below there, we are much more prone to sellers taking over.
See today’s economic calendar with a rundown of releases.
THE RANGE OF TUESDAY’S MOTION
E-mini S&P 500 Futures (ES_F)
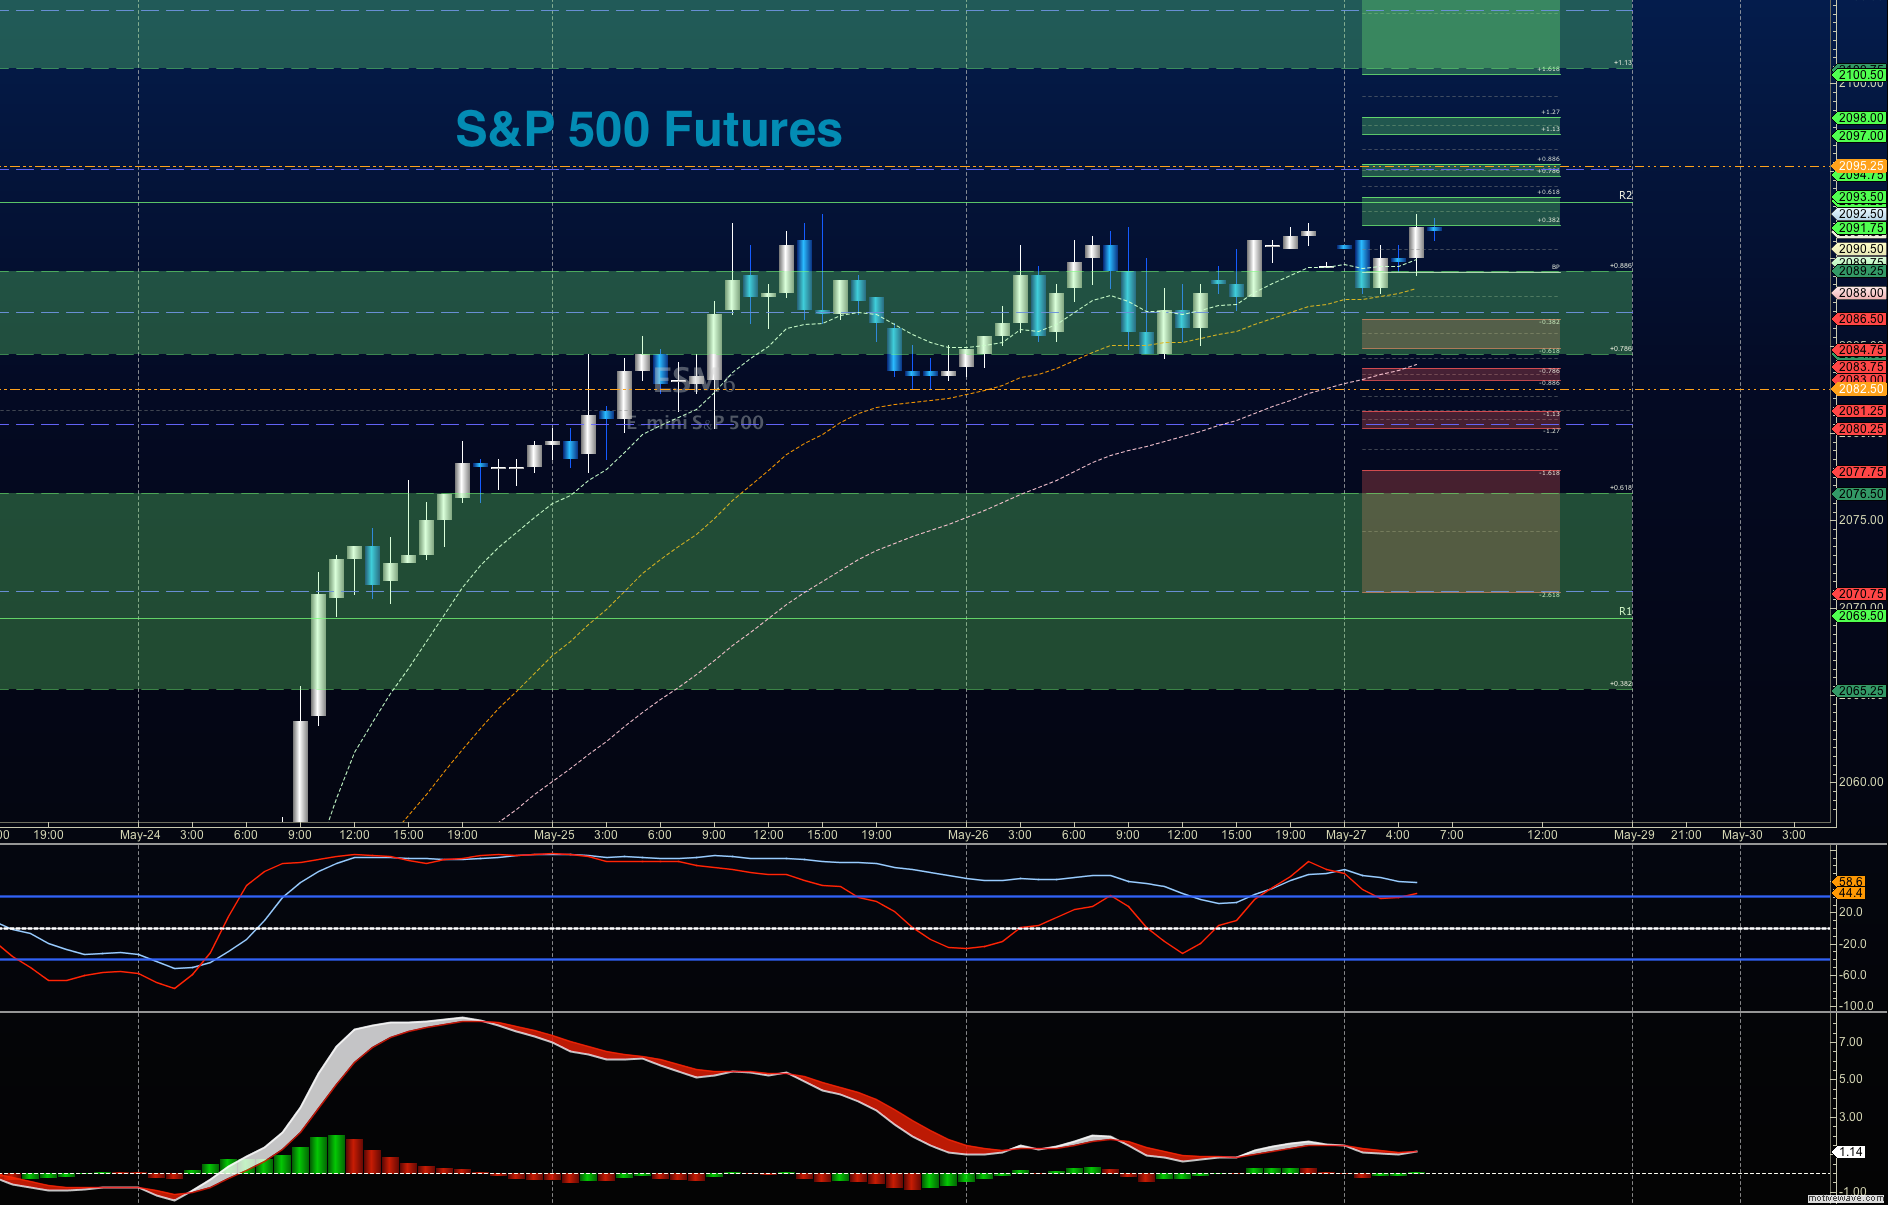
Outlook for May 26, 2016 – Momentum sits with the buyers for yet another day, and they are testing near resistance right now- much as yesterday, but with less momentum. Sellers hold control of the area between 2092.5 and 2097.5, and if they are moved aside in the face of current momentum.
Upside trades on S&P 500 futures – Favorable setups sit on the positive retest of 2089, or a positive retest of 2092.5 with positive momentum. I use the 30min to 1hr chart for the breach and retest mechanic. Targets from 2089 are 2092, 2093.5, and if we can catch a bid there, we could expand into 2095.25, and 2097.5. A retest of these levels that hold will press the chart into resistance ahead near 2102.75, but that still seems unlikely here.
Downside trades on S&P 500 futures – Favorable setups sit below the failed retest of 2086.5 or at the failed retest of 2092.5 with negative divergence. It is important to watch for higher lows to develop with the 2092.5 entry, as strength of motion still sits with the buyers. Retracement into lower levels from 2092.5 gives us the targets 2090, 2088.5, 2084.75, 2082.25, 2078.75, 2075.75, 2072.5, 2070.5, 2068.25, and perhaps a retest near 2060 before bouncing- but that also does not seem likely here.
Have a look at the Fibonacci levels marked in the blog for more targets.
Crude Oil Futures (CL_F)
Outlook for crude oil futures for May 27, 2016 – After a test of 50.2, oil prices began a retrace into support. As I mentioned yesterday, the pressure at these levels in the chart was likely to force a retrace, and the question is now, where can we find support.
The trading range for oil prices suggest support action near 48.4, and resistance behavior near 49.94.
Upside trades on crude oil futures can be staged on the positive retest of 49.4, or after a dip into 48.45, but carefully watch for a failure of hold the range near 48.2. I often use the 30min to 1hr chart for the breach and retest mechanic. Targets from 48.45 are 48.65, 48.85, 49.2, 49.46, 49.74, 49.97, and 50.04. If we expand over that, we could see 50.4, 50.65, and even 50.92, but selling pressure looks heavy here today.
Downside trades on crude oil futures continue to setup well below failed retests. Today, this is the failed retest of 49.7, or at the failed retest of 48.85 with negative divergence. These setups give us targets into 49.57, 49.43, 49.34, 49.16, 48.86, 48.66, 48.45, 48.27, 47.97, and perhaps 47.64 – but that seems unlikely here today.
Have a look at the Fibonacci levels marked in the blog for more targets.
If you’re interested in the live trading room, it is now primarily stock market futures content, though we do track heavily traded stocks and their likely daily trajectories as well – we begin at 9am with a morning report and likely chart movements along with trade setups for the day.
As long as the trader keeps himself aware of support and resistance levels, risk can be very adequately managed to play in either direction as bottom picking remains a behavior pattern that is developing with value buyers and speculative traders.
Twitter: @AnneMarieTrades
The author trades stock market futures every day and may have a position in mentioned securities at the time of publication. Any opinions expressed herein are solely those of the author, and do not in any way represent the views or opinions of any other person or entity.

 Rolling Over At Key Fibonacci Level?")


