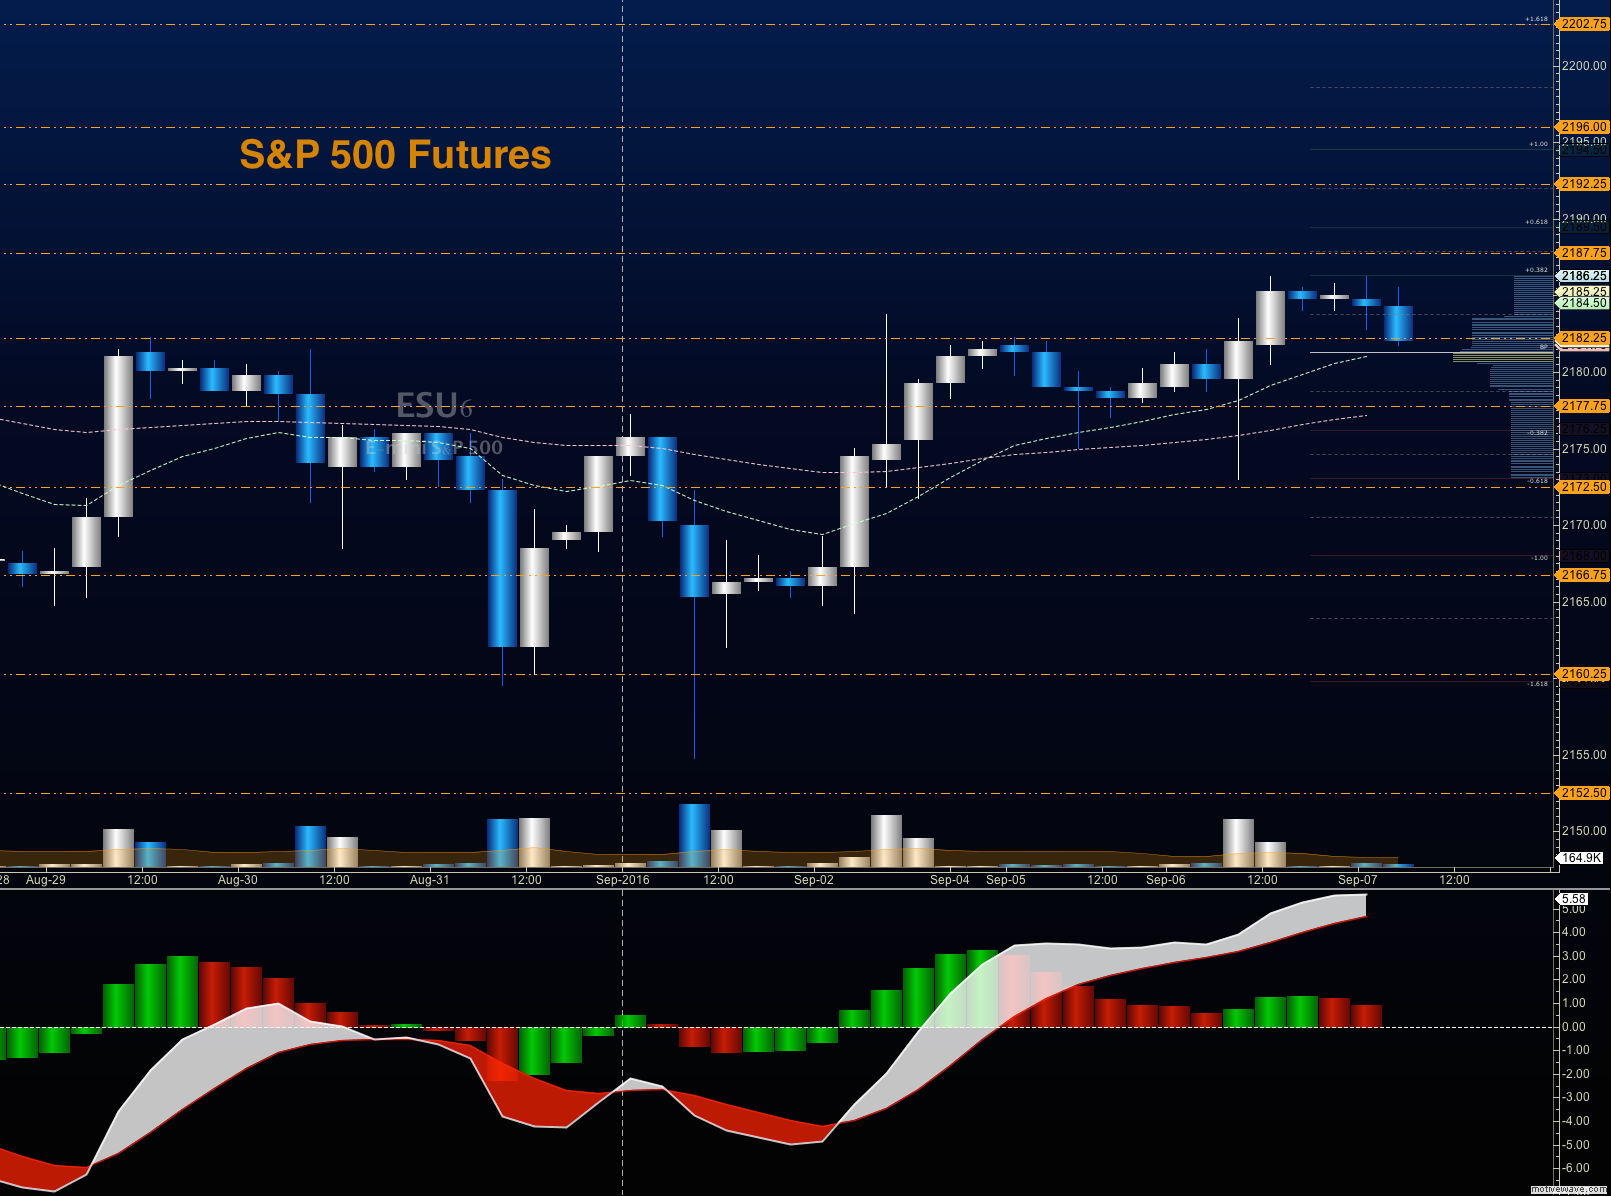
S&P 500 futures trading and market outlook for September 7, 2016 –
The S&P 500 (INDEXSP:.INX) is attempting another breakout, but none of our futures charts have breached key resistance levels and/or prior highs. Today could be the day that the stock market does it IF there is a squeeze at the resistance levels above. S&P 500 futures trading is holding at support this morning around 2180. However, traders are having trouble getting past 2187.5 – this level still stands as key price resistance. Market momentum is on the rise, so pay attention to any breach of the levels noted above. A failure to return below 2182 could signal a breakout. And clearing 2185,5 and holding a retest of it will be key to provide intraday direction to the upside.
See today’s economic calendar with a rundown of releases.
RANGE OF TODAY’S MOTION
S&P 500 Futures Trading Outlook For September 7th
Upside trades in S&P 500 futures trading – Favorable setups sit on the positive retest of 2185.5, or a positive retest of the bounce off 2180.5 with upward momentum. I use the 30min to 1hr chart for the breach and retest mechanic. Targets from 2180.5 are 2182.25, 2185.25, 2187.75, 2189.25, and if we expand, we may stretch above into 2192, 2194.75, and 2197.75. A deeper support test near 2174 could also bring buyers back onto the playground – so use caution there.
Downside trades in S&P 500 futures trading – Favorable setups sit below the failed retest of 2180, or at the failed retest of 2184 with negative divergence. Retracement into lower levels from 2184 give us the targets 2180.5, 2178.75, 2176, 2172.25, 2170.5, 2168.75, 2165.25, 2160.5, 2158.25, 2154.75, and perhaps 2149.5.
If you’re interested in watching these trades go live, join us in the live trading room from 9am to 11:30am each trading day.
Nasdaq Futures
The NQ_F performed nicely yesterday, and sits at the top of resistance. A pullback into support looks likely with the current form, with buyers waiting at value areas below. There are two congested support regions below – between 4820 and 4824, and between 4826 and 4831. Resistance sits between 4835-4842.5.
Upside trades on Nasdaq futures – Favorable setups sit on the positive retest of 4830.25, or a positive retest of 4826 with positive momentum. I use the 30min to 1hr chart for the breach and retest mechanic. Targets from 4826 are 4828.25, 4830.25, 4832.75, 4834.5, 4837.5, and 4842.75, if buyers continue to reverse the recent dip.
Downside trades-Favorable setups sit below the failed retest of 4820, or at the failed retest of 4831 with negative divergence. Retracement into lower levels from 4831 gives us the targets 4828.5, 4862.5, 4823.5, 4820.5, 4818, 4812.25, 4809, 4805.5 and 4801.25 if sellers resume control.
Crude Oil
The API report is released after the close today due to the US holiday on Monday. The chart is marked by sideways motion over the last couple of days as traders try to find their way. Wide range bound behavior is likely. Support sits near 44.68, with 44.38 below that. Resistance sits near 45.76 but could stretch into 46.11 above that.
Trading ranges for crude oil should hold between 44.14 and 46.11 today.
Upside trades on crude oil can be staged on the positive retest of 45.27, or at a positive retest off 44.68 with positive momentum. I often use the 30min to 1hr chart for the breach and retest mechanic. Targets from 44.68 are 45.05, 45.21, 45.47, 45.76, 45.97, and 46.11, if buyers really power forward.
Downside trades on crude oil can be staged on the failed retest of 44.74 or at the failed retest of 45.25 with negative divergence. Targets from 45.25 are 45.05, 44.74, 44.55, 44.22, 44.08, 43.81, 43.59, 43.38, 43.24, 43.11, 42.9, and 42.62.
If you’re interested in the live trading room, it is now primarily stock market futures content, though we do track heavily traded stocks and their likely daily trajectories as well – we begin at 9am with a morning report and likely chart movements along with trade setups for the day.
As long as the trader keeps himself aware of support and resistance levels, risk can be very adequately managed to play in either direction as bottom picking remains a behavior pattern that is developing with value buyers and speculative traders.
Twitter: @AnneMarieTrades
The author trades stock market futures every day and may have a position in mentioned securities at the time of publication. Any opinions expressed herein are solely those of the author, and do not in any way represent the views or opinions of any other person or entity.

 Rolling Over At Key Fibonacci Level?")

 Rolling Over At Key Fibonacci Level?")


